Venous return

Venous return is the rate of blood flow back to the heart.

Under steady-state conditions, venous return must equal cardiac output (Q), when averaged over time because the cardiovascular system is essentially a closed loop.

Although the above relationship is true for the hemodynamic factors that determine the flow of blood from the veins back to the heart, it is important not to lose sight of the fact that blood flow through the entire systemic circulation represents both the cardiac output and the venous return, which are equal in the steady-state because the circulatory system is closed.

[2] It is often suggested that venous return dictates cardiac output, effected through the Frank Starling mechanism.

It is confusion about these terms that has led some physiologists to suggest that the emphasis on 'venous return' be turned instead to more measurable and direct influences on cardiac output such as end diastolic pressure and volume which can be causally related to cardiac output and through which the influences of volume status, venous capacitance, ventricular compliance and venodilating therapies can be understood.
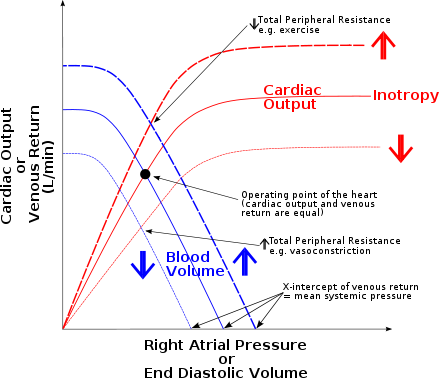
The horizontal axis of Guyton diagram represents right atrial pressure or central venous pressure , and the vertical axis represents cardiac output or venous return. The red curve sloping upward to the right is the cardiac output curve , and the blue curve sloping downward to the right is the venous return curve . A steady state is formed at the point where the two curves meet.
Trend of central venous pressure as a consequence of variations in cardiac output . The three functions indicate the trend in physiological conditions (in the centre), in those of decreased preload (e.g. in hemorrhage , bottom curve) and in those of increased preload (e.g. following transfusion , top curve).
The cardiac function curve expresses how systemic flow changes as a function of the central venous pressure ; it represents the Frank-Starling mechanism . The vascular function curve expresses how "central venous pressure" changes as a function of "systemic flow". Note that, for cardiac function curve, "central venous pressure" is the independent variable and "systemic flow" is the dependent variable; for vascular function curve, the opposite is true.
Venous return curves showing the normal curve when the mean systemic filling pressure (Psf) is 7 mm Hg and the effect of altering the Psf to 3.5, 7, or 14 mm Hg.