Radiocarbon calibration
Calibration is needed because the atmospheric 14C/12C ratio, which is a key element in calculating radiocarbon ages, has not been constant historically.
[1] Willard Libby, the inventor of radiocarbon dating, pointed out as early as 1955 the possibility that the ratio might have varied over time.
The first such published sequence, based on bristlecone pine tree rings, was created in the 1960s by Wesley Ferguson.
[11] The improvements to these curves are based on new data gathered from tree rings, varves, coral, and other studies.
Significant additions to the datasets used for INTCAL13 include non-varved marine foraminifera data, and U-Th dated speleothems.
These can be accessed online; they allow the user to enter a date range at one standard deviation confidence for the radiocarbon ages, select a calibration curve, and produce probabilistic output both as tabular data and in graphical form.
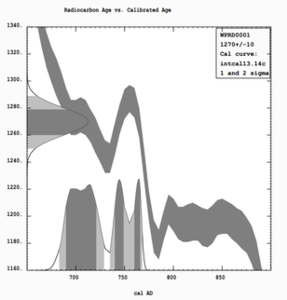
[15][16] In the example CALIB output shown at left, the input data is 1270 BP, with a standard deviation of 10 radiocarbon years.
Before the widespread availability of personal computers made probabilistic calibration practical, a simpler "intercept" method was used.
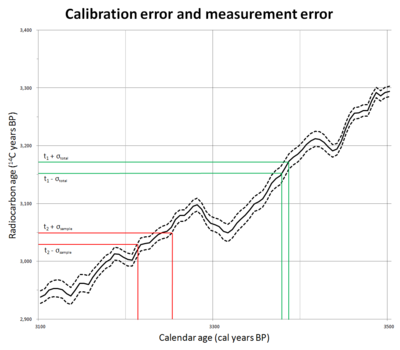
In places where the calibration curve is steep, and does not change direction, as in example t1 in blue on the graph to the right, the resulting calendar year range is quite narrow.
Wiggle-matching can be used in places where there is a plateau on the calibration curve, and hence can provide a much more accurate date than the intercept or probability methods are able to produce.
[19] The technique is not restricted to tree rings; for example, a stratified tephra sequence in New Zealand, known to predate human colonization of the islands, has been dated to 1314 AD ± 12 years by wiggle-matching.
Unless the samples are definitely of the same age (for example, if they were both physically taken from a single item) a statistical test must be applied to determine if the dates do derive from the same object.
Once this is done the error for the pooled mean age can be calculated, giving a final answer of a single date and range, with a narrower probability distribution (i.e., greater accuracy) as a result of the combined measurements.