Infrared spectroscopy
It is used to study and identify chemical substances or functional groups in solid, liquid, or gaseous forms.
Units of IR wavelength are commonly given in micrometers (formerly called "microns"), symbol μm, which are related to the wavenumber in a reciprocal way.
The higher-energy near-IR, approximately 14,000–4,000 cm−1 (0.7–2.5 μm wavelength) can excite overtone or combination modes of molecular vibrations.
[1] The names and classifications of these subregions are conventions, and are only loosely based on the relative molecular or electromagnetic properties.
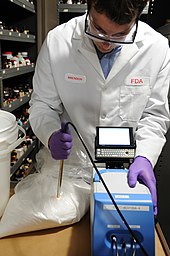
Infrared spectroscopy is a simple and reliable technique widely used in both organic and inorganic chemistry, in research and industry.
[citation needed] It is also used in forensic analysis in both criminal and civil cases, for example in identifying polymer degradation.
[9] Other developments include a miniature IR-spectrometer that's linked to a cloud based database and suitable for personal everyday use,[10] and NIR-spectroscopic chips[11] that can be embedded in smartphones and various gadgets.
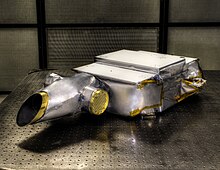
In catalysis research it is a very useful tool to characterize the catalyst,[12][13][14] as well as to detect intermediates[15] Infrared spectroscopy coupled with machine learning and artificial intelligence also has potential for rapid, accurate and non-invasive sensing of bacteria.
Extraction of the essential features therefore requires advanced statistical methods such as machine learning and deep-neural networks.
The potential of this technique for bacteria classification have been demonstrated for differentiation at the genus,[17] species[18] and serotype[19] taxonomic levels, and it has also been shown promising for antimicrobial susceptibility testing,[20][21][22] which is important for many clinical settings where faster susceptibility testing would decrease unnecessary blind-treatment with broad-spectrum antibiotics.
The compression and extension of a bond may be likened to the behaviour of a spring, but real molecules are hardly perfectly elastic in nature.
[25] In order for a vibrational mode in a sample to be "IR active", it must be associated with changes in the molecular dipole moment.
For example, in water, the rocking, wagging, and twisting modes do not exist because these types of motions of the H atoms represent simple rotation of the whole molecule rather than vibrations within it.
Alternatively, the entire wavelength range is measured using a Fourier transform instrument and then a transmittance or absorbance spectrum is extracted.
One common method is to crush the sample with an oily mulling agent (usually mineral oil Nujol).
The second method is to grind a quantity of the sample with a specially purified salt (usually potassium bromide) finely (to remove scattering effects from large crystals).
This is one of the most important ways of analysing failed plastic products for example because the integrity of the solid is preserved.
More elaborate methods, such as a "two-beam" setup (see figure), can correct for these types of effects to give very accurate results.
Nevertheless, among different absorption-based techniques which are used for gaseous species detection, Cavity ring-down spectroscopy (CRDS) can be used as a calibration-free method.
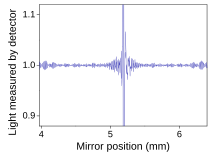
A moving mirror inside the apparatus alters the distribution of infrared light that passes through the interferometer.
The signal directly recorded, called an "interferogram", represents light output as a function of mirror position.
A data-processing technique called Fourier transform turns this raw data into the desired result (the sample's spectrum): light output as a function of infrared wavelength (or equivalently, wavenumber).
Recently, high-resolution EELS (HREELS) has emerged as a technique for performing vibrational spectroscopy in a transmission electron microscope (TEM).
[42] Analysis of vibrational modes that are IR-inactive but appear in inelastic neutron scattering is also possible at high spatial resolution using EELS.
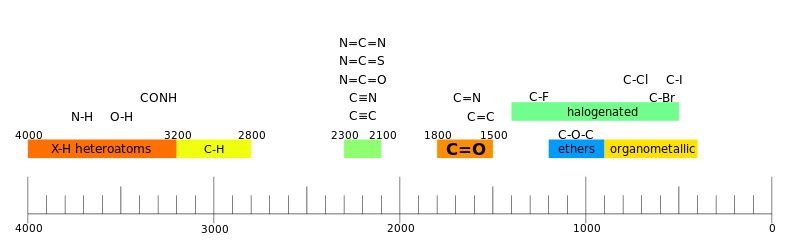
[44] IR spectroscopy is often used to identify structures because functional groups give rise to characteristic bands both in terms of intensity and position (frequency).
In such cases further information can be gleaned about the strength on a bond, relying on the empirical guideline called Badger's rule.
The typical waiting time lasts from zero to several picoseconds, and the duration can be controlled with a resolution of tens of femtoseconds.
This allows the observation of coupling between different vibrational modes; because of its extremely fine time resolution, it can be used to monitor molecular dynamics on a picosecond timescale.
As with two-dimensional nuclear magnetic resonance (2DNMR) spectroscopy, this technique spreads the spectrum in two dimensions and allows for the observation of cross peaks that contain information on the coupling between different modes.
The COSY variant of nonlinear two-dimensional infrared spectroscopy has been used for determination of the secondary structure content of proteins.