Jet stream
In World War II, the Japanese used the jet stream to carry Fu-Go balloon bombs across the Pacific Ocean to launch small attacks on North America.
[13][14] Many sources credit real understanding of the nature of jet streams to regular and repeated flight-path traversals during World War II.
[15] Similarly in 1944 a team of American meteorologists in Guam, including Reid Bryson, had enough observations to forecast very high west winds that would slow bombers raiding Japan.
[30] The path of jet streams affects cyclonic storm systems at lower levels in the atmosphere, and so knowledge of their course has become an important part of weather forecasting.
Therefore, the strong eastward moving jet streams are in part a simple consequence of the fact that the Equator is warmer than the north and south poles.
This causes a sharp north–south pressure (south–north potential vorticity) gradient in the horizontal plane, an effect which is most significant during double Rossby wave breaking events.
Air masses that begin moving poleward are deflected eastward by the Coriolis force (true for either hemisphere), which for poleward moving air implies an increased westerly component of the winds[36] The subtropical jet stream rounding the base of the mid-oceanic upper trough is thought[37] to be one of the causes most of the Hawaiian Islands have been resistant to the long list of Hawaii hurricanes that have approached.
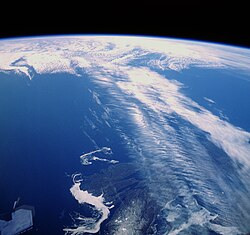
For example, when Hurricane Flossie (2007) approached and dissipated just before reaching landfall, the U.S. National Oceanic and Atmospheric Administration (NOAA) cited vertical wind shear as evidenced in the photo.
Archer & Caldeira[52] claim that the Earth's jet streams could generate a total power of 1700 terawatts (TW) and that the climatic impact of harnessing this amount would be negligible.
However, Miller, Gans, & Kleidon[53] claim that the jet streams could generate a total power of only 7.5 TW and lacks the potential to make a significant contribution to renewable energy.
[55] El Niño–Southern Oscillation (ENSO) influences the average location of upper-level jet streams, and leads to cyclical variations in precipitation and temperature across North America, as well as affecting tropical cyclone development across the eastern Pacific and Atlantic basins.
[58] During the Niño portion of ENSO, increased precipitation falls along the Gulf coast and Southeast due to a stronger than normal, and more southerly, polar jet stream.
[59] Snowfall is greater than average across the southern Rockies and Sierra Nevada mountain range, and is well below normal across the Upper Midwest and Great Lakes states.
[63] In the southern hemisphere, the subtropical jet stream is displaced equatorward, or north, of its normal position, which diverts frontal systems and thunderstorm complexes from reaching central portions of the continent.
[57] Across North America during La Niña, increased precipitation is diverted into the Pacific Northwest due to a more northerly storm track and jet stream.
[64] The storm track shifts far enough northward to bring wetter than normal conditions (in the form of increased snowfall) to the Midwestern states, as well as hot and dry summers.
Normally, the jet stream flows east over the Gulf of Mexico and turns northward pulling up moisture and dumping rain onto the Great Plains.
[73][74] While the Arctic remains one of the coldest places on Earth today, the temperature gradient between it and the warmer parts of the globe will continue to diminish with every decade of global warming as the result of this amplification.
If this gradient has a strong influence on the jet stream, then it will eventually become weaker and more variable in its course, which would allow more cold air from the polar vortex to leak mid-latitudes and slow the progression of Rossby waves, leading to more persistent and more extreme weather.
[75] While some paleoclimate reconstructions have suggested that the polar vortex becomes more variable and causes more unstable weather during periods of warming back in 1997,[76] this was contradicted by climate modelling, with PMIP2 simulations finding in 2010 that the Arctic Oscillation (AO) was much weaker and more negative during the Last Glacial Maximum, and suggesting that warmer periods have stronger positive phase AO, and thus less frequent leaks of the polar vortex air.
[82] At the time, it was also suggested that this connection between Arctic amplification and jet stream patterns was involved in the formation of Hurricane Sandy[83] and played a role in the early 2014 North American cold wave.
[87][88] Further work from Francis and Vavrus that year suggested that amplified Arctic warming is observed as stronger in lower atmospheric areas because the expanding process of warmer air increases pressure levels which decreases poleward geopotential height gradients.
[100] A 2019 analysis of a data set collected from 35 182 weather stations worldwide, including 9116 whose records go beyond 50 years, found a sharp decrease in northern midlatitude cold waves since the 1980s.
[101] Moreover, a range of long-term observational data collected during the 2010s and published in 2020 suggests that the intensification of Arctic amplification since the early 2010s was not linked to significant changes on mid-latitude atmospheric patterns.
[104][105] In 2022, a follow-up study found that while the PAMIP average had likely underestimated the weakening caused by sea ice decline by 1.2 to 3 times, even the corrected connection still amounts to only 10% of the jet stream's natural variability.
[106] Additionally, a 2021 study found that while jet streams had indeed slowly moved polewards since 1960 as was predicted by models, they did not weaken, in spite of a small increase in waviness.
[108] Finally, a 2021 study was able to reconstruct jet stream patterns over the past 1,250 years based on Greenland ice cores, and found that all of the recently observed changes remain within range of natural variability: the earliest likely time of divergence is in 2060, under the Representative Concentration Pathway 8.5 which implies continually accelerating greenhouse gas emissions.
[114] A similar phenomenon develops across Australia, which pulls moisture poleward from the Coral Sea towards cut-off lows which form mainly across southwestern portions of the continent.
The Somali Jet, which forms off the East African coast is an important component of the global Hadley circulation,[119] and supplies water vapour to the Asian Monsoon.
[121] The formation of the thermal low over northern Africa leads to a low-level westerly jet stream from June into October, which provides the moist inflow to the West African monsoon.