Lift-to-drag ratio
For a glider it determines the glide ratio, of distance travelled against loss of height.
The term is calculated for any particular airspeed by measuring the lift generated, then dividing by the drag at that speed.
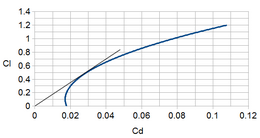
In almost all cases the graph forms a U-shape, due to the two main components of drag.
It depends principally on the lift and drag coefficients, angle of attack to the airflow and the wing aspect ratio.
The L/D ratios for hydrofoil boats and displacement craft are determined similarly to aircraft.
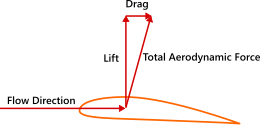
Lift can be created when an aerofoil-shaped body travels through a viscous fluid such as air.
At low speeds an aircraft has to generate lift with a higher angle of attack, which results in a greater induced drag.
This term dominates the low-speed side of the graph of lift versus velocity.
For this reason profile drag is more pronounced at greater speeds, forming the right side of the lift/velocity graph's U shape.
Profile drag is lowered primarily by streamlining and reducing cross section.
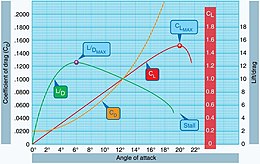
The varying ratio of lift to drag with AoA is often plotted in terms of these coefficients.
Like all things in aeronautical engineering, the lift-to-drag ratio is not the only consideration for wing design.
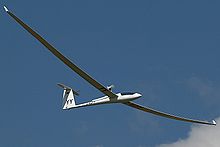
This is especially of interest in the design and operation of high performance sailplanes, which can have glide ratios almost 60 to 1 (60 units of distance forward for each unit of descent) in the best cases, but with 30:1 being considered good performance for general recreational use.
In zero wind conditions, L/D will equal distance traveled divided by altitude lost.
Achieving the maximum distance for altitude lost in wind conditions requires further modification of the best airspeed, as does alternating cruising and thermaling.
To achieve high speed across country, glider pilots anticipating strong thermals often load their gliders (sailplanes) with water ballast: the increased wing loading means optimum glide ratio at greater airspeed, but at the cost of climbing more slowly in thermals.
Also, the faster airspeed means the aircraft will fly at greater Reynolds number and this will usually bring about a lower zero-lift drag coefficient.
the span efficiency factor, a number less than but close to unity for long, straight-edged wings, and
It can be shown that two main drivers of maximum lift-to-drag ratio for a fixed wing aircraft are wingspan and total wetted area.
The equation demonstrates the importance of wetted aspect ratio in achieving an aerodynamically efficient design.