Magnetic resonance elastography
First developed and described at Mayo Clinic by Muthupillai et al. in 1995, MRE has emerged as a powerful, non-invasive diagnostic tool, namely as an alternative to biopsy and serum tests for staging liver fibrosis.
[7] This principle of operation is the basis for the longstanding practice of palpation, which, however, is limited (except at surgery) to superficial organs and pathologies, and by its subjective, qualitative nature, depending on the skill and touch sensitivity of the practitioner.
Conventional imaging techniques of CT, MRI, US, and nuclear medicine are unable to offer any insight on the elastic modulus of soft tissue.
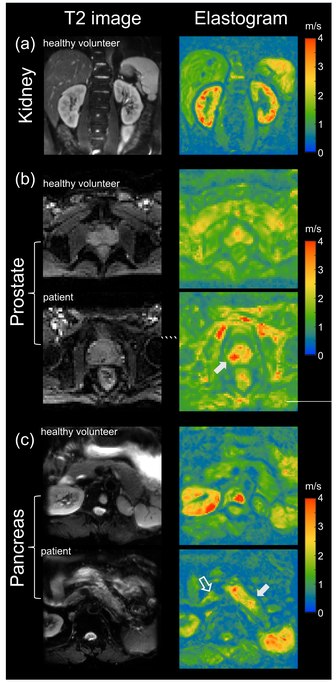
[2] MRE, as a quantitative method of assessing tissue stiffness, provides reliable insight to visualize a variety of disease processes which affect tissue stiffness in the liver, brain, heart, pancreas, kidney, spleen, breast, uterus, prostate, and skeletal muscle.
[2][3][8] MRE is conducted in three steps: first, a mechanical vibrator is used on the surface of the patient's body to generate shear waves that travel into the patient's deeper tissues; second, an MRI acquisition sequence measures the propagation and velocity of the waves; and finally this information is processed by an inversion algorithm to quantitatively infer and map tissue stiffness in 3-D.[2][3] This stiffness map is called an elastogram, and is the final output of MRE, along with conventional 3-D MRI images as shown on the right.
[2] MRE quantitatively determines the stiffness of biological tissues by measuring its mechanical response to an external stress.
The area of the hysteresis loop represents the amount of energy lost as heat when a viscoelastic material undergoes an applied stress and is distorted.
[9] Yet, MRE and other elastography imaging techniques typically utilize a mechanical parameter estimation that assumes biological tissues to be linearly elastic and isotropic for simplicity purposes.
[11] This relationship can be used to estimate the stiffness of biological tissues based on the calculated shear modulus from shear-wave propagation measurements.
A driver system produces and transmits acoustic waves set at a specific frequency (50–500 Hz) to the tissue sample.
Recent studies have been focused on incorporating mechanical parameter estimations into post-processing inverse algorithms that account for the complex viscoelastic behavior of soft tissues.
Patients should fast for 3 to 4 hours prior to their MRE exam to allow for the most accurate measurement of liver stiffness.
A standardized approach for performing and analyzing liver MRE exams has been documented by the RSNA Quantitative Imaging Biomarkers Alliance.
[36][37] A recent study looked into both the isotropic and anisotropic stiffness in brain and found a correlation between the two and with age, particularly in gray matter.
Whereas functional magnetic resonance imaging (fMRI) infers brain activity by detecting relatively slow changes in blood flow, functional MRE is capable of detecting neuromechanical changes in the brain related to neuronal activity occurring on the 100-millisecond scale.
To overcome these challenges, researchers have been looking at different passive drivers and imaging techniques to best deliver shear waves to the kidneys.
[61] To ensure good shear wave penetration in the prostate gland, different actuator systems were designed and evaluated.
Even higher specificity of 95% for prostate cancer was achieved when Magnetic Resonance Elastography was combined with systematic image interpretation using PI-RADS (version 2.1).