Sensitivity and specificity
In medicine and statistics, sensitivity and specificity mathematically describe the accuracy of a test that reports the presence or absence of a medical condition.
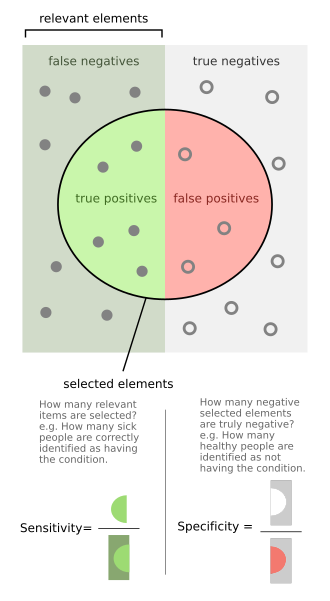
If individuals who have the condition are considered "positive" and those who do not are considered "negative", then sensitivity is a measure of how well a test can identify true positives and specificity is a measure of how well a test can identify true negatives: If the true status of the condition cannot be known, sensitivity and specificity can be defined relative to a "gold standard test" which is assumed correct.
This is especially important when people who are identified as having a condition may be subjected to more testing, expense, stigma, anxiety, etc.
[1] There are different definitions within laboratory quality control, wherein "analytical sensitivity" is defined as the smallest amount of substance in a sample that can accurately be measured by an assay (synonymously to detection limit), and "analytical specificity" is defined as the ability of an assay to measure one particular organism or substance, rather than others.
If it turns out that the sensitivity is high then any person who has the disease is likely to be classified as positive by the test.
On the other hand, if the specificity is high, any person who does not have the disease is likely to be classified as negative by the test.
In this case, a negative test result would definitively rule out the presence of the disease in a patient.
Specificity refers to the test's ability to correctly reject healthy patients without a condition.
However, a negative result from a test with high specificity is not necessarily useful for "ruling out" disease.
When moving to the right, the opposite applies, the specificity increases until it reaches the B line and becomes 100% and the sensitivity decreases.
The middle solid line in both figures above that show the level of sensitivity and specificity is the test cutoff point.
As previously described, moving this line results in a trade-off between the level of sensitivity and specificity.
When the dotted line, test cut-off line, is at position A, the test correctly predicts all the population of the true positive class, but it will fail to correctly identify the data point from the true negative class.
Similar to the previously explained figure, the red dot indicates the patient with the medical condition.
However, in this case, the green background indicates that the test predicts that all patients are free of the medical condition.
These concepts are illustrated graphically in this applet Bayesian clinical diagnostic model which show the positive and negative predictive values as a function of the prevalence, sensitivity and specificity.
[7][8] This has led to the widely used mnemonics SPPIN and SNNOUT, according to which a highly specific test, when positive, rules in disease (SP-P-IN), and a highly sensitive test, when negative, rules out disease (SN-N-OUT).
[9][10][11] The SNNOUT mnemonic has some validity when the prevalence of the condition in question is extremely low in the tested sample.
The tradeoff between specificity and sensitivity is explored in ROC analysis as a trade off between TPR and FPR (that is, recall and fallout).
On the other hand, this hypothetical test demonstrates very accurate detection of cancer-free individuals (NPV ≈ 99.5%).
This assumption of very large numbers of true negatives versus positives is rare in other applications.
Similarly to the domain of information retrieval, in the research area of gene prediction, the number of true negatives (non-genes) in genomic sequences is generally unknown and much larger than the actual number of genes (true positives).
The convenient and intuitively understood term specificity in this research area has been frequently used with the mathematical formula for precision and recall as defined in biostatistics.
[27] [28] [29] [30] Conversely, the term specificity in a sense of true negative rate would have little, if any, application in the genome analysis research area.