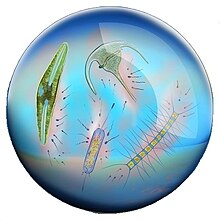
Zooplankton constitute the second trophic level in the food chain, and include microscopic one-celled organisms called protozoa as well as small crustaceans, such as copepods and krill, and the larva of fish, squid, lobsters and crabs.
Marine phytoplankton mostly inhabit sunlit surface waters as photoautotrophs, and require nutrients such as nitrogen and phosphorus, as well as sunlight to fix carbon and produce oxygen.
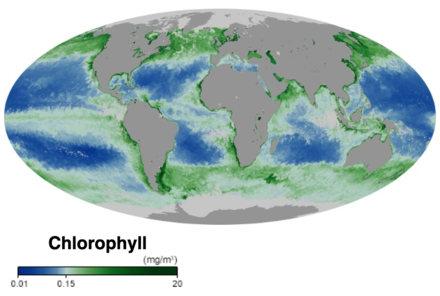
[15] Like plants on land, phytoplankton use chlorophyll and other light-harvesting pigments to carry out photosynthesis, absorbing atmospheric carbon dioxide to produce sugars for fuel.
Thus, in ocean environments, the first bottom trophic level is occupied principally by phytoplankton, microscopic drifting organisms, mostly one-celled algae, that float in the sea.
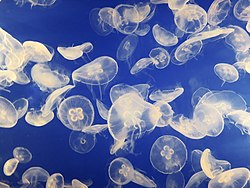
With body plans largely based on water, they were typically considered to have a limited impact on marine ecosystems, attracting the attention of specialized predators such as the ocean sunfish and the leatherback sea turtle.
Jellyfish, and more generally gelatinous zooplankton which include salps and ctenophores, are very diverse, fragile with no hard parts, difficult to see and monitor, subject to rapid population swings and often live inconveniently far from shore or deep in the ocean.
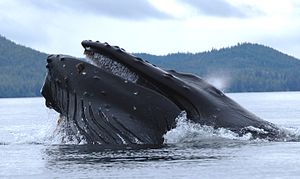
[26] But jellyfish bloom in vast numbers, and it has been shown they form major components in the diets of tuna, spearfish and swordfish as well as various birds and invertebrates such as octopus, sea cucumbers, crabs and amphipods.
[34] Viral shunting helps maintain diversity within the microbial ecosystem by preventing a single species of marine microbe from dominating the micro-environment.
[36] In general, dissolved organic carbon (DOC) is introduced into the ocean environment from bacterial lysis, the leakage or exudation of fixed carbon from phytoplankton (e.g., mucilaginous exopolymer from diatoms), sudden cell senescence, sloppy feeding by zooplankton, the excretion of waste products by aquatic animals, or the breakdown or dissolution of organic particles from terrestrial plants and soils.
[47] The impact of CroV on natural populations of C. roenbergensis remains unknown; however, the virus has been found to be very host specific, and does not infect other closely related organisms.
Chytrids zoospores are excellent food for zooplankton in terms of size (2–5 μm in diameter), shape, nutritional quality (rich in polyunsaturated fatty acids and cholesterols).
[52][53] For pelagic ecosystems, Legendre and Rassoulzadagan proposed in 1995 a continuum of trophic pathways with the herbivorous food-chain and microbial loop as food-web end members.
The efficiency of the microbial loop depends on multiple factors but in particular on the relative importance of predation and viral lysis to the mortality of heterotrophic microbes.
Traditionally gelatinous predators were thought ineffectual providers of marine trophic pathways, but they appear to have substantial and integral roles in deep pelagic food webs.
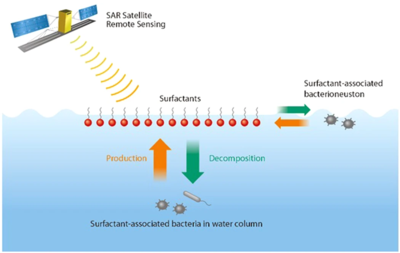
Having the ability to detect these "invisible" surfactant-associated bacteria using synthetic aperture radar has immense benefits in all-weather conditions, regardless of cloud, fog, or daylight.
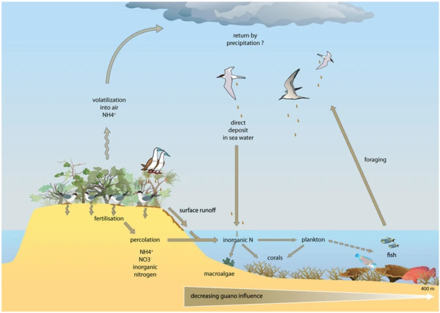
(3) under the alkaline conditions, typical of the seabird feces, the NH3 is rapidly volatilised and transformed to NH4+, (4) which is transported out of the colony, and through wet-deposition exported to distant ecosystems, which are eutrophised.
This element is found in a number of chemical forms in the seabird fecal material, but the most mobile and bioavailable is orthophosphate, (5) which can be leached by subterranean or superficial waters.
[123] In 2020 researchers reported that measurements over the last two decades on primary production in the Arctic Ocean show an increase of nearly 60% due to higher concentrations of phytoplankton.
As grazing by macrofauna is limited in most of these polar regions, viruses are being recognised for their role as important agents of mortality, thereby influencing the biogeochemical cycling of nutrients that, in turn, impact community dynamics at seasonal and spatial scales.
[135][136][137] They are found in a range of habitats, including subglacial lakes and cryoconite holes, making the cold biomes of these polar regions replete with metabolically diverse microorganisms and sites of active biogeochemical cycling.
[141] The separation is not just by distance: Antarctica is surrounded by the Southern Ocean that is driven by the strong Antarctic Circumpolar Current, whereas the Arctic is ringed by landmasses.
Magnetic and gravity data point to the evolution of the Arctic, driven by the Amerasian and Eurasian basins, from 145 to 161 million years ago to a cold polar region of water and ice surrounded by land.
[154][155] Paine developed the concept to explain his observations and experiments on the relationships between marine invertebrates of the intertidal zone (between the high and low tide lines), including starfish and mussels.
[176] The diagram illustrates the material fluxes, populations, and molecular pools that are impacted by five cryptic interactions: mixotrophy, ontogenetic and species differences, microbial cross‐feeding, auxotrophy and cellular carbon partitioning.
For example, cellular carbon partition in phytoplankton can affect both downstream pools of organic matter utilised in microbial cross‐feeding and exchanged in cases of auxotrophy, as well as prey selection based on ontogenetic and species differences.
The length of the chain, or trophic level, is a measure of the number of species encountered as energy or nutrients move from plants to top predators.
[187] Top-down cascades can be important for understanding the knock-on effects of removing top predators from food webs, as humans have done in many places through hunting and fishing.
The rate at which organic matter is preserved via burial by accumulating sediments is only between 0.2 and 0.4 billion tonnes per year, representing a very small fraction of the total production.
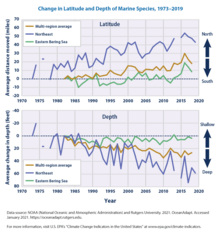
[205] Where fishermen currently know where certain fish species occupy, as the shift occurs it will be more difficult to figure out where they are spending their time, costing them more money as they may have to travel further.
Through a survey conducted at Princeton University, researchers found that the marine species are consistently keeping pace with "climate velocity" or speed and direction in which it is moving.
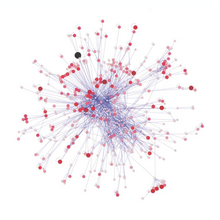
The pelagic
food web
, showing the central involvement of
marine microorganisms
in how the ocean imports nutrients from and then exports them back to the atmosphere and ocean floor
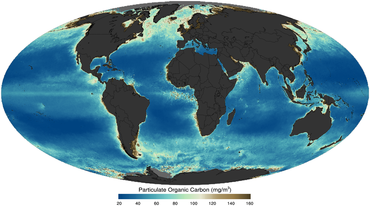
Ocean surface chlorophyll concentrations in October 2019. The concentration of chlorophyll can be used as a
proxy
to indicate how many phytoplankton are present. Thus on this global map green indicates where a lot of phytoplankton are present, while blue indicates where few phytoplankton are present. – NASA Earth Observatory 2019.
[
11
]
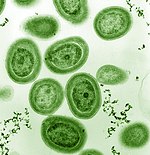
Prochlorococcus
, an influential bacterium which produces much of the world's oxygen
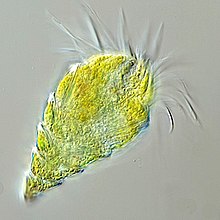
The
oligotrich ciliate
has been characterised as the most important herbivore in the ocean
Jellyfish are easy to capture and digest and may be more important as food sources than was previously thought.
[
25
]
On average there are more than one million microbial cells in every drop of seawater, and their collective metabolisms not only recycle nutrients that can then be used by larger organisms but also catalyze key chemical transformations that maintain Earth's habitability.
[
31
]
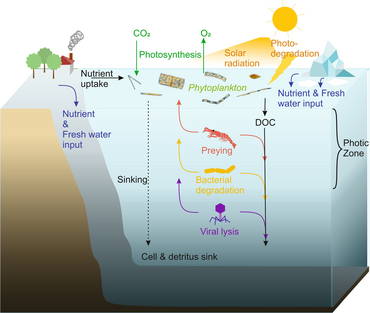
Cycling of marine phytoplankton. Phytoplankton live in the photic zone of the ocean, where photosynthesis is possible. During photosynthesis, they assimilate carbon dioxide and release oxygen. If solar radiation is too high, phytoplankton may fall victim to photodegradation. For growth, phytoplankton cells depend on nutrients, which enter the ocean by rivers, continental weathering, and glacial ice meltwater on the poles. Phytoplankton release dissolved organic carbon (DOC) into the ocean. Since phytoplankton are the basis of marine food webs, they serve as prey for zooplankton, fish larvae and other heterotrophic organisms. They can also be degraded by bacteria or by viral lysis. Although some phytoplankton cells, such as dinoflagellates, are able to migrate vertically, they are still incapable of actively moving against currents, so they slowly sink and ultimately fertilize the seafloor with dead cells and detritus.
[
38
]
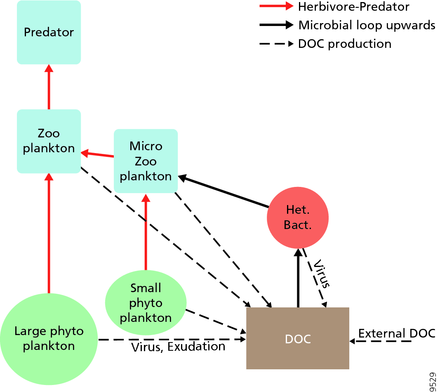
Food web structure in the euphotic zone. The linear food chain large phytoplankton-herbivore-predator (on the left with red arrow connections) has fewer levels than one with small phytoplankton at the base. The microbial loop refers to the flow from the dissolved organic carbon (DOC) via heterotrophic bacteria (Het. Bac.) and microzooplankton to predatory zooplankton (on the right with black solid arrows). Viruses play a major role in the mortality of phytoplankton and heterotrophic bacteria, and recycle organic carbon back to the DOC pool. Other sources of dissolved organic carbon (also dashed black arrows) includes exudation, sloppy feeding, etc. Particulate detritus pools and fluxes are not shown for simplicity.
[
54
]
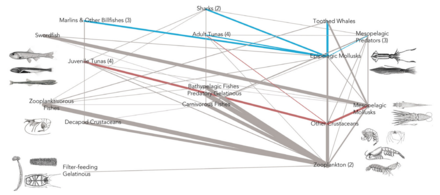
An
in situ
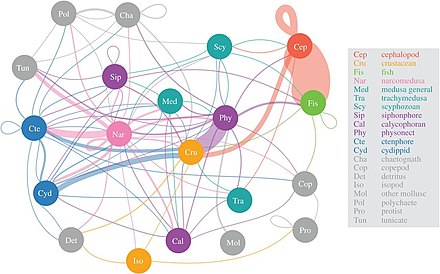
perspective of a deep pelagic food web derived from ROV-based observations of feeding, as represented by 20 broad taxonomic groupings. The linkages between predator to prey are coloured according to predator group origin, and loops indicate within-group feeding. The thickness of the lines or edges connecting food web components is scaled to the log of the number of unique ROV feeding observations across the years 1991–2016 between the two groups of animals. The different groups have eight colour-coded types according to main animal types as indicated by the legend and defined here: red, cephalopods; orange, crustaceans; light green, fish; dark green, medusa; purple, siphonophores; blue, ctenophores and grey, all other animals. In this plot, the vertical axis does not correspond to trophic level, because this metric is not readily estimated for all members.
[
64
]
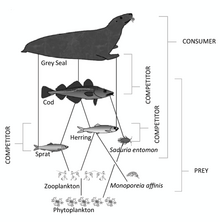
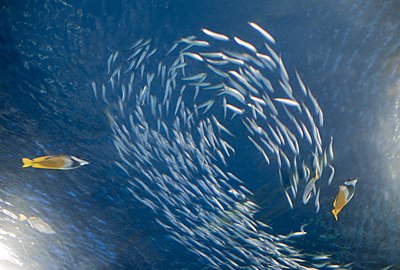
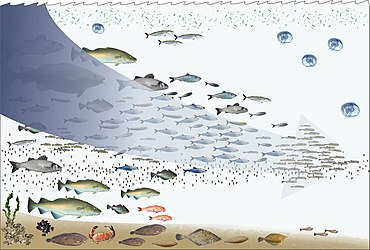
Oceanic pelagic food web showing energy flow from micronekton to top predators. Line thickness is scaled to the proportion in the diet.
[
70
]
Bacteria, sea slicks and satellite remote sensing. Surfactants are capable of dampening the short capillary ocean surface waves and smoothing the sea surface.
Synthetic aperture radar
(SAR) satellite remote sensing can detect areas with concentrated surfactants or sea slicks, which appear as dark areas on the SAR images.
[
71
]
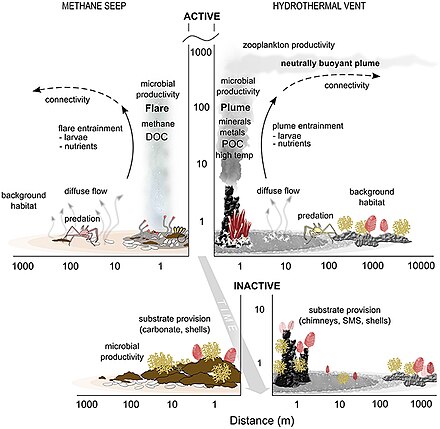
Conceptual diagram of faunal community structure and food-web patterns along fluid-flux gradients within
Guaymas
seep and vent ecosystems.
[
74
]
[
75
]
[
76
]
Pathways for guano-derived nitrogen to enter marine food webs
[
94
]
Antarctic marine food web. Potter Cove 2018. Vertical position indicates trophic level and node widths are proportional to total degree (in and out). Node colors represent functional groups.
[
131
]
[
132
]
Common-enemy graph of Antarctic food web. Potter Cove 2018. Nodes represent basal species and links indirect interactions (shared predators). Node and link widths are proportional to number of shared predators. Node colors represent functional groups.
[
131
]
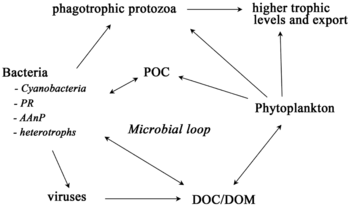
Sea ice food web and the microbial loop.
[
133
]
[
134
]
AAnP = aerobic anaerobic phototroph, DOC = dissolved organic carbon, DOM = dissolved organic matter, POC = particulate organic carbon, PR = proteorhodopsins.
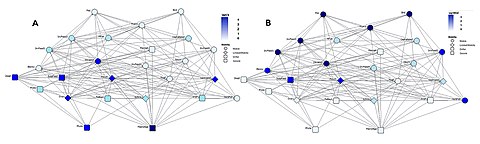
Topological positions versus mobility:
[
161
]
(A) bottom-up groups (sessile and drifters), (B) groups at the top of the food web. Phyto, phytoplankton; MacroAlga, macroalgae; Proto, pelagic protozoa; Crus, Crustacea; PelBact, pelagic bacteria; Echino, Echinoderms; Amph, Amphipods; HerbFish, herbivorous fish; Zoopl, zooplankton; SuspFeed, suspension feeders; Polych, polychaetes; Mugil, Mugilidae; Gastropod, gastropods; Blenny, omnivorous blennies; Decapod, decapods; Dpunt, Diplodus puntazzo; Macropl, macroplankton; PlFish, planktivorous fish; Cephalopod, cephalopods; Mcarni, macrocarnivorous fish; Pisc, piscivorous fish; Bird, seabirds; InvFeed1 through InvFeed4, benthic invertebrate feeders.
Cryptic interactions in the marine food web.
[
176
]
Red:
mixotrophy
; green:
ontogenetic
and species differences; purple: microbial cross‐feeding; orange:
auxotrophy
; blue: cellular carbon partitioning.
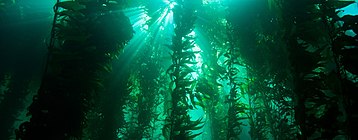
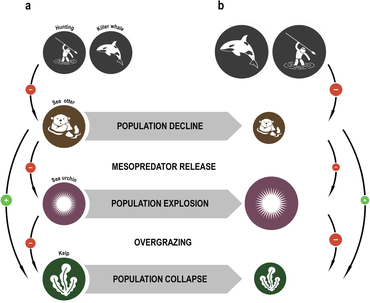
Schematic representation of the changes in abundance between trophic groups in a temperate rocky reef ecosystem. (a) Interactions at equilibrium. (b) Trophic cascade following disturbance. In this case, the otter is the dominant predator and the macroalgae are kelp. Arrows with positive (green, +) signs indicate positive effects on abundance while those with negative (red, -) indicate negative effects on abundance. The size of the bubbles represents the change in population abundance and associated altered interaction strength following disturbance.
[
177
]
[
178
]
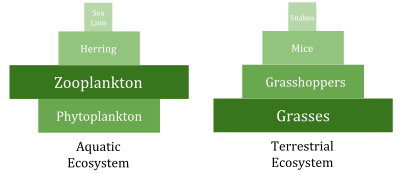
Biomass pyramids
. Compared to terrestrial biomass pyramids, aquatic pyramids are generally inverted at the base.
Ocean or marine biomass, in a reversal of terrestrial biomass, can increase at higher trophic levels.
[
194
]
Marine Species Changes in Latitude and Depth in three different ocean regions(1973–2019)
[
207
]
[
208
]
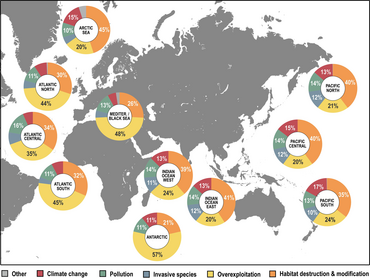
The distribution of anthropogenic stressors faced by marine species threatened with extinction in various marine regions of the world. Numbers in the pie charts indicate the percentage contribution of an anthropogenic stressors' impact in a specific marine region.
[
177
]
[
212
]
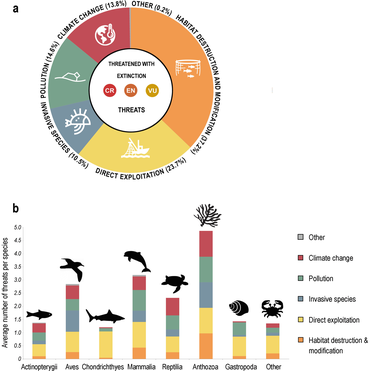
Anthropogenic stressors to marine species threatened with extinction
[
177
]