Mathematical diagram
These are named after Jean-Robert Argand (1768–1822), although they were first described by Norwegian-Danish land surveyor and mathematician Caspar Wessel (1745–1818).
[2] Argand diagrams are frequently used to plot the positions of the poles and zeroes of a function in the complex plane.
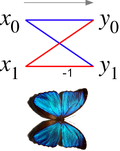
In the context of fast Fourier transform algorithms, a butterfly is a portion of the computation that combines the results of smaller discrete Fourier transforms (DFTs) into a larger DFT, or vice versa (breaking a larger DFT up into subtransforms).
The same structure can also be found in the Viterbi algorithm, used for finding the most likely sequence of hidden states.
Concretely, one represents each element of the set as a vertex on the page and draws a line segment or curve that goes upward from x to y precisely when x < y and there is no z such that x < z < y.
In a Hasse diagram, it is required that the curves be drawn so that each meets exactly two vertices: its two endpoints.
Any such diagram (given that the vertices are labeled) uniquely determines a partial order, and any partial order has a unique transitive reduction, but there are many possible placements of elements in the plane, resulting in different Hasse diagrams for a given order that may have widely varying appearances.
[4] The Venn diagram is constructed with a collection of simple closed curves drawn in the plane.
[5] A Voronoi diagram is a special kind of decomposition of a metric space determined by distances to a specified discrete set of objects in the space, e.g., by a discrete set of points.
In the simplest case, we are given a set of points S in the plane, which are the Voronoi sites.
The segments of the Voronoi diagram are all the points in the plane that are equidistant to two sites.