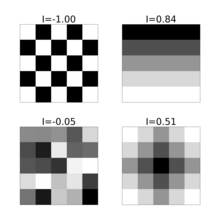
Moran's I
[1][2] Spatial autocorrelation is characterized by a correlation in a signal among nearby locations in space.
can depend quite a bit on the assumptions built into the spatial weights matrix
This is related to Tobler's first law of geography, which states that Everything depends on everything else, but closer things more so—in other words, the law implies a spatial distance decay function, such that even though all observations have an influence on all other observations, after some distance threshold that influence can be neglected.
The idea is to construct a matrix that accurately reflects your assumptions about the particular spatial phenomenon in question.
A common approach is to give a weight of 1 if two zones are neighbors, and 0 otherwise, though the definition of 'neighbors' can vary.
Sometimes the length of a shared edge is used for assigning different weights to neighbors.
The selection of spatial weights matrix should be guided by theory about the phenomenon in question.
is quite sensitive to the weights and can influence the conclusions you make about a phenomenon, especially when using distances.
For statistical hypothesis testing, Moran's I values can be transformed to z-scores.
Global spatial autocorrelation analysis yields only one statistic to summarize the whole study area.
The fact that Moran's I is a summation of individual cross products is exploited by the "local indicators of spatial association" (LISA) to evaluate the clustering in those individual units by calculating Local Moran's I for each spatial unit and evaluating the statistical significance for each Ii.
LISAs can be calculated in GeoDa and ArcGIS Pro which uses the Local Moran's I,[5][6] proposed by Luc Anselin in 1995.
[7] Moran's I is widely used in the fields of geography and geographic information science.