Multiangle light scattering
It is used for determining both the absolute molar mass and the average size of molecules in solution, by detecting how they scatter light.
The "multi-angle" term refers to the detection of scattered light at different discrete angles as measured, for example, by a single detector moved over a range that includes the particular angles selected or an array of detectors fixed at specific angular locations.
A discussion of the physical phenomenon related to this static light scattering, including some applications, data analysis methods and graphical representations associated therewith are presented.
The then-conventional use of a single detector rotated about an illuminated sample with intensities collected at specific angles was called differential light scattering[6] after the quantum mechanical term differential cross section,[7] σ(θ) expressed in milli-barns/steradian.
Differential cross section measurements were commonly made, for example, to study the structure of the atomic nucleus by scattering from them nucleons,[8] such as neutrons.
In modern instruments, the beam is generally plane-polarized perpendicular to the plane of measurement, though other polarizations may be used especially when studying anisotropic particles.
Earlier measurements, before the introduction of lasers, were performed using focused, though unpolarized, light beams from sources such as Hg-arc lamps.
If single-particles scattering properties are to be measured, a means to introduce such particles one-at-a-time through the light beam at a point generally equidistant from the surrounding detectors must be provided.
By 1988, a three-dimensional configuration was introduced[9] specifically to measure the scattering properties of single aerosol particles.
At about the same time, the underwater device was built to measure the scattered light properties of single phytoplankton.
This type of scattering is responsible for the blue color of the sky during the day and is inversely proportional to the fourth power of wavelength.
Consider now a MALS measurement made in a plane from a suspension of N identical particles/molecules per ml illuminated by a fine beam of light produced by a laser.
The excess Rayleigh ratio, R(θ), is then given by Even for a simple homogeneous sphere of radius a whose refractive index, n, is very nearly the same as the refractive index "n0" of the suspending fluid, i.e. Rayleigh–Gans approximation, the scattering function in the scattering plane is the relatively complex quantity and λ0 is the wavelength of the incident light in vacuum.
Early implementations of MALS such as those discussed by Bruno H. Zimm in his paper "Apparatus and Methods for Measurement and Interpretation of the Angular Variation of Light Scattering; Preliminary Results on Polystyrene Solutions"[1] involved using a single detector rotated about a sample contained within a transparent vessel.
When plotted one can extrapolate to both zero angle and zero concentration, and analysis of the plot will give the mean square radius of the sample molecules from the initial slope of the c=0 line and the molar mass of the molecule at the point where both concentration and angle equal zero.
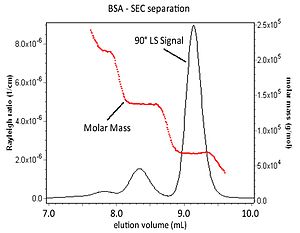
[26] With the advent of size exclusion chromatography (SEC), MALS measurements began to be used in conjunction with an on-line concentration detector to determine absolute molar mass and size of sample fractions eluting from the column, rather than depending on calibration techniques.
The angular dependence of light scattering data is shown below in a figure of mix of polystyrene spheres which was separated by SEC.
The sample, second to the right shows a linear angular variation with the intensity increasing at lower scattering angles.
The 90° light scattering signal from a MALS detector and the molar mass values for each elution slice are shown.
As MALS can provide molar mass and size of molecules, it permits study into protein-protein binding, oligomerization and the kinetics of self-assembly, association and dissociation.
By comparing the molar mass of a sample to its concentration, one can determine the binding affinity and stoichiometry of interacting molecules.
is the mean square radius of branched and linear macromolecules with identical molar masses.
[27] By utilizing MALS in conjunction with a concentration detector as described above, one create a log-log plot of the root-mean-square radius vs molar mass.
An increase in the slope of the plot indicates a variation in conformation of a polymer from spherical to random coil to linear.
Other MALS applications include nanoparticle sizing,[29][30][31] protein aggregation studies, protein-protein interactions, electrophoretic mobility or zeta potential.