Multispecies coalescent process
It has important implications for the theory and practice of phylogenetics[3][4] and for understanding genome evolution.
A gene tree is a binary graph that describes the evolutionary relationships between a sample of sequences for a non-recombining locus.
The Multispecies Coalescent model provides a framework for inferring species phylogenies while accounting for ancestral polymorphism and gene tree-species tree conflict.
In other words, the exact coalescent time for any two loci with the same gene tree may differ.
However, it is convenient to break up the trees based on whether the coalescence occurred before or after the earliest speciation event.
Given the internal branch length in coalescent units it is straightforward to calculate the probability of each gene tree.
[9] For diploid organisms the branch length in coalescent units is the number of generations between the speciation events divided by twice the effective population size.
Where the branch length in coalescent units (T) is also written in an alternative form: the number of generations (t) divided by twice the effective population size (Ne).
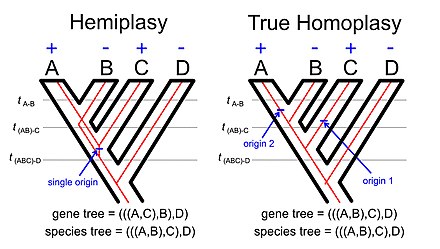
The phenomenon of hemiplasy is a natural extension of the basic idea underlying gene tree-species tree discordance.
If we examine the illustration of hemiplasy with using a rooted four-taxon tree (see image to the right) the lineage between the common ancestor of taxa A, B, and C and the common ancestor of taxa A and B must be polymorphic for the allele with the derived trait (e.g., a transposable element insertion[12]) and the allele with the ancestral trait.
The concept of incomplete lineage sorting ultimately reflects on persistence of polymorphisms across one or more speciation events.
The probability density of the gene trees under the multispecies coalescent model is discussed along with its use for parameter estimation using multi-locus sequence data.
Complete isolation after species divergence, with no migration, hybridization, or introgression is also assumed.
We assume no recombination so that all the sites within the locus share the same gene tree (topology and coalescent times).
However, the basic model can be extended in different ways to accommodate migration or introgression, population size changes, recombination.
As an example, the species tree of the great apes: humans (H), chimpanzees (C), gorillas (G) and orangutans (O) is considered.
The topology of the species tree, (((HC)G)O)), is assumed known and fixed in the analysis (Figure 1).
's) are measured by the expected number of mutations per site from the ancestral node in the species tree to the present time (Figure 1 of Rannala and Yang, 2003).
In addition, to derive the probability of a particular gene tree topology in the population, if a coalescent event occurs in a sample of
[16] Due to the assumption of independent evolution across the loci, The likelihood function or the probability of the sequence data given the parameters
[18] Full-likelihood or full-data methods, based on calculation of the likelihood function on sequence alignments, have thus mostly relied on Markov chain Monte Carlo algorithms.
MCMC algorithms under the multispecies coalescent model are similar to those used in Bayesian phylogenetics but are distinctly more complex, mainly due to the fact that the gene trees at multiple loci and the species tree have to be compatible: sequence divergence has to be older than species divergence.
Considerable efforts have been taken to design smart algorithms that change the species tree and gene trees in a coordinated manner, as in the rubber-band algorithm for changing species divergence times,[1] the coordinated NNI, SPR and NodeSlider moves.
[21][22] The basic multispecies coalescent model can be extended in a number of ways to accommodate major factors of the biological process of reproduction and drift.
[23][24] Incorporating episodic hybridization/introgression leads to the MSC with introgression (MSci)[25] or multispecies-network-coalescent (MSNC) model.
[26][27] The multispecies coalescent has profound implications for the theory and practice of molecular phylogenetics.
[33] This is important because the "concatenation approach," where multiple sequence alignments from different loci are concatenated to form a single large supermatrix alignment that is then used for maximum likelihood (or Bayesian MCMC) analysis, is both easy to implement and commonly used in empirical studies.
This represents a case of model misspecification because the concatenation approach implicitly assumes that all gene trees have the same topology.
[34] Indeed, it has now been proven that analyses of data generated under the multispecies coalescent using maximum likelihood analysis of a concatenated data are not guaranteed to converge on the true species tree as the number of loci used for the analysis increases[35][36][37] (i.e., maximum likelihood concatenation is statistically inconsistent).
There are two basic approaches for phylogenetic estimation in the multispecies coalescent framework: 1) full-likelihood or full-data methods which operate on multilocus sequence alignments directly, including both maximum likelihood and Bayesian methods, and 2) summary methods, which use a summary of the original sequence data, including the two-step methods that use estimated gene trees as summary input and SVDQuartets, which use site pattern counts pooled over loci as summary input.