Oort constants
are empirically derived parameters that characterize the local rotational properties of our galaxy, the Milky Way, in the following manner: where
[1] From the Oort constants, it is possible to determine the orbital properties of the Sun, such as the orbital velocity and period, and infer local properties of the Galactic disk, such as the mass density and how the rotational velocity changes as a function of radius from the Galactic Center.
By the 1920s, a large fraction of the astronomical community had recognized that some of the diffuse, cloud-like objects, or nebulae, seen in the night sky were collections of stars located beyond our own, local collection of star clusters.
The concentrated band of starlight that is the visible signature of the Milky Way was indicative of a disk structure for our galaxy; however, our location within our galaxy made structural determinations from observations difficult.
For external disk galaxies, one can measure the rotation curve by observing the Doppler shifts of spectral features measured along different galactic radii, since one side of the galaxy will be moving towards our line of sight and one side away.
However, our position in the Galactic midplane of the Milky Way, where dust in molecular clouds obscures most optical light in many directions, made obtaining our own rotation curve technically difficult until the discovery of the 21 cm hydrogen line in the 1930s.
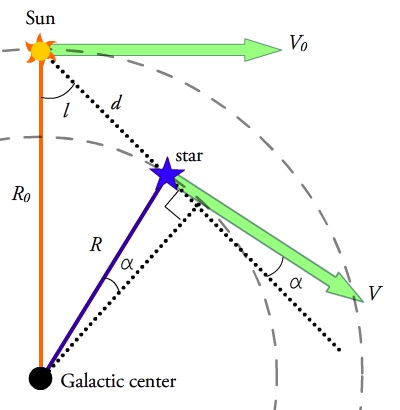
Assume that both the star and the Sun have circular orbits around the center of the Galaxy at radii of
and we can substitute this into the velocity expressions: From the geometry in Figure 1, one can see that the triangles formed between the Galactic Center, the Sun, and the star share a side or portions of sides, so the following relationships hold and substitutions can be made: and with these we get To put these expressions only in terms of the known quantities
yields: where At this stage, the observable velocities are related to these coefficients and the position of the star.
as: Thus, the Oort constants can be expressed in terms of the radial and transverse velocities, distances, and galactic longitudes of objects in our Galaxy - all of which are, in principle, observable quantities.
The simple derivation above assumed that both the Sun and the object in question are traveling on circular orbits about the Galactic center.
The derivation also implicitly assumes that the gravitational potential of the Milky Way is axisymmetric and always directed towards the center.
Finally, both transverse velocity and distance are notoriously difficult to measure for objects which are not relatively nearby.
We do not know, however, the non-circular components of the velocity of each individual star we observe, so they cannot be compensated for in this way.
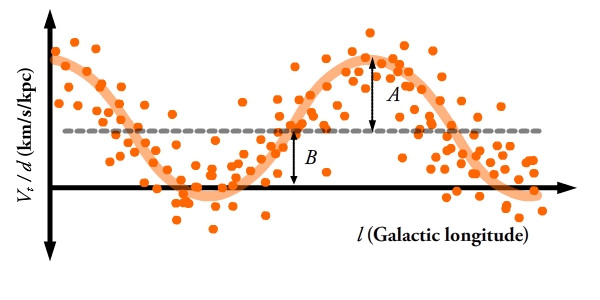
But, if we plot transverse velocity divided by distance against galactic longitude for a large sample of stars, we know from the equations above that they will follow a sine function.
The non-circular velocities will introduce scatter around this line, but with a large enough sample the true function can be fit for and the values of the Oort constants measured, as shown in figure 2.
Measuring transverse velocities and distances accurately and without biases remains challenging, though, and sets of derived values for
The major differences usually lie in what sorts of objects are used and details of how distance or proper motion are measured.
, but from his conclusion that the Galaxy was nearly in Keplerian rotation (as in example 2 below), we can presume he would have gotten a value of around −10 km s−1 kpc−1.
[5] These differ significantly from modern values, which is indicative of the difficulty of measuring these constants.
[11] The Gaia spacecraft, launched in 2013, is an updated successor to Hipparcos; which allowed new and improved levels of accuracy in measuring four Oort constants
However, the time it takes for the Sun to go around the Milky Way (a galactic year) may be longer because (in a simple model) it is circulating around a point further from the centre of the galaxy where Ω is smaller (see Sun#Orbit in Milky Way).
This gives the following values for the average proper motion of stars in our neighborhood at different galactic longitudes, after correction for the effect due to the Sun's velocity with respect to the local standard of rest: The motion of the sun towards the solar apex in Hercules adds a generally westward component to the observed proper motions of stars around Vela or Centaurus and a generally eastward component for stars around Cygnus or Cassiopeia.
For example, Sagittarius A*, the radio source at the centre of the galaxy, will have a proper motion of approximately Ω or 5.7 mas/y southwestward (with a small adjustment due to the Sun's motion toward the solar apex) even though it is in Sagittarius.
describes the angular momentum gradient in the solar neighborhood, also referred to as vorticity.
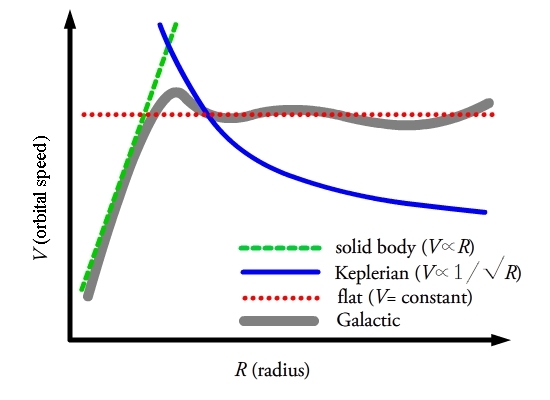
To illuminate this point, one can look at three examples that describe how stars and gas orbit within the Galaxy giving intuition as to the meaning of
This is what one would expect because there is no difference in orbital velocity as radius increases, thus no stress between the annuli.
This is close to the actual measured Oort constants and tells us that the constant-speed model is the closest of these three to reality in the solar neighborhood.
What one should take away from these three examples, is that with a remarkably simple model, the rotation of the Milky Way can be described by these two constants.
A relative curve can be derived from studying the motions of gas clouds in the Milky Way, but to calibrate the actual absolute speeds involved requires knowledge of V0.