Ordinal data
[1]: 2 These data exist on an ordinal scale, one of four levels of measurement described by S. S. Stevens in 1946.
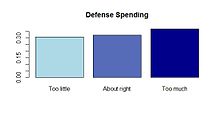
[3] A well-known example of ordinal data is the Likert scale.
Sometimes data on an interval scale or ratio scale are grouped onto an ordinal scale: for example, individuals whose income is known might be grouped into the income categories $0–$19,999, $20,000–$39,999, $40,000–$59,999, ..., which then might be coded as 1, 2, 3, 4, .... Other examples of ordinal data include socioeconomic status, military ranks, and letter grades for coursework.
[5] Ordinal data analysis requires a different set of analyses than other qualitative variables.
[1]: 88 Computing the mean of a sample of ordinal data is discouraged; other measures of central tendency, including the median or mode, are generally more appropriate.
[6] Stevens (1946) argued that, because the assumption of equal distance between categories does not hold for ordinal data, the use of means and standard deviations for description of ordinal distributions and of inferential statistics based on means and standard deviations was not appropriate.
Instead, positional measures like the median and percentiles, in addition to descriptive statistics appropriate for nominal data (number of cases, mode, contingency correlation), should be used.
[3]: 678 Nonparametric methods have been proposed as the most appropriate procedures for inferential statistics involving ordinal data (e.g, Kendall's W, Spearman's rank correlation coefficient, etc.
[7][8][4]: 90 In place of means and standard deviations, univariate statistics appropriate for ordinal data include the median,[9]: 59–61 other percentiles (such as quartiles and deciles),[9]: 71 and the quartile deviation.
[5]: 87–95 Analysis of variance with ranks[9]: 367–369 and the Jonckheere test for ordered alternatives[5]: 216–222 can be conducted with ordinal data in place of independent samples ANOVA.
[5]: 184–188 Correlation measures appropriate for two ordinal-scaled variables include Kendall's tau,[9]: 436–439 gamma,[9]: 442–443 rs,[9]: 434–436 and dyx/dxy.
In logistic regression, the equation is the model and c takes on the assigned levels of the categorical scale.
[1]: 189 In regression analysis, outcomes (dependent variables) that are ordinal variables can be predicted using a variant of ordinal regression, such as ordered logit or ordered probit.
In multiple regression/correlation analysis, ordinal data can be accommodated using power polynomials and through normalization of scores and ranks.
[10] Linear trends are also used to find associations between ordinal data and other categorical variables, normally in a contingency tables.
R is calculated by: Classification methods have also been developed for ordinal data.
The data are divided into different categories such that each observation is similar to others.
Dispersion is measured and minimized in each group to maximize classification results.
[12] Four major classes of model are described below, each defined for a random variable
However, this generalization can make it much more difficult to fit the model to the data.
And if the values of the covariates change, then for that new data the fitted scores
Note that the size of the reference category in the proportional odds model varies with
, whereas in the other models the size of the reference category remains fixed, as
[13] A bump chart—a line chart that shows the relative ranking of items from one time point to the next—is also appropriate for ordinal data.
[14] Color or grayscale gradation can be used to represent the ordered nature of the data.
A single-direction scale, such as income ranges, can be represented with a bar chart where increasing (or decreasing) saturation or lightness of a single color indicates higher (or lower) income.
[15] Choropleth maps also use color or grayscale shading to display ordinal data.
Settings where ordinal data are often collected include the social and behavioral sciences and governmental and business settings where measurements are collected from persons by observation, testing, or questionnaires.
Some common contexts for the collection of ordinal data include survey research;[17][18] and intelligence, aptitude, personality testing and decision-making.
[2][4]: 89–90 Calculation of 'Effect Size' (Cliff's Delta d) using ordinal data has been recommended as a measure of statistical dominance.