However, polyamorphism requires two distinct amorphous states with a clear, discontinuous (first-order) phase transition between them.
Different local structures can produce amorphous phases of the same chemical composition with different physical properties such as density.
Liquid–liquid transitions were originally considered by Rapoport in 1967 in order to explain high pressure melting curve maxima of some liquid metals.
[5] Rapoport's theory requires the existence of a melting curve maximum in polyamorphic systems.
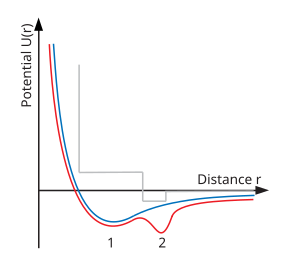
One physical explanation for polyamorphism is the existence of a double well inter-atomic pair potential (see lower right diagram).
[2] Polyamorphism has been experimentally observed or theoretically suggested in silicon, liquid phosphorus, triphenyl phosphate, mannitol, and in some other molecular network-forming substances.
Consequent warming to 127 K at ambient pressure transforms this phase to a low-density amorphous ice (0.94 g/cm3 at 1 bar).
[8][9] A similar abrupt liquid-amorphous phase transition is predicted in liquid silicon when cooled under high pressures.
[10] This observation is based on first principles molecular dynamics computer simulations, and might be expected intuitively since tetrahedral amorphous carbon, silicon, and germanium are known to be structurally analogous to water.
Pressure–temperature
phase diagram
, including an illustration of the liquid–liquid transition line proposed for several polyamorphous materials. This liquid–liquid
phase transition
would be a first order,
discontinuous
transition between low and high density liquids (labelled 1 and 2). This is analogous to
polymorphism
of crystalline materials, where different stable crystalline states (solid 1, 2 in diagram) of the same substance can exist (e.g. diamond and graphite are two polymorphs of carbon). Like the ordinary liquid–gas transition, the liquid–liquid transition is expected to end in a
liquid-liquid critical point
. At temperatures beyond these critical points there is a continuous range of fluid states, i.e. the distinction between liquids and gasses is lost. If crystallisation is avoided the liquid–liquid transition can be extended into the metastable
supercooled liquid
regime.
Schematic of interatomic pair potentials. The blue line is a typical
Lennard-Jones type potential
, which exhibits the ordinary liquid–gas critical point. The red line is a double well type potential, which is proposed for polyamorphous systems.
[
1
]
The grey line, is a representative of the soft core square well potentials, which in atomisitc simulations exhibit liquid–liquid transitions and a second critical point.
[
2
]
The numbers 1 and 2 correspond to the 1st and second minima in the potentials.