Ratio of uniforms
The ratio of uniforms is a method initially proposed by Kinderman and Monahan in 1977[1] for pseudo-random number sampling, that is, for drawing random samples from a statistical distribution.
The basic idea of the method is to use a change of variables to create a bounded set, which can then be sampled uniformly to generate random variables following the original distribution.
One feature of this method is that the distribution to sample is only required to be known up to an unknown multiplicative factor, a common situation in computational statistics and statistical physics.
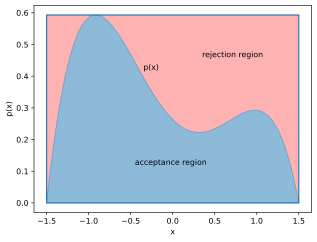
When the probability density function of the distribution is bounded and has finite support, one can define a bounding box around it (a uniform proposal distribution), draw uniform samples in the box and return only the x coordinates of the points that fall below the function (see graph).
As a direct consequence of the fundamental theorem of simulation,[2] the returned samples are distributed according to the original distribution.
When the support of the distribution is infinite, it is impossible to draw a rectangular bounding box containing the graph of the function.
One can still use rejection sampling, but with a non-uniform proposal distribution.
The method of the ratio of uniforms offers a solution to this problem, by essentially using as proposal distribution the distribution created by the ratio of two uniform random variables.
The statement and the proof are adapted from the presentation by Gobet[4] Theorem — Let
be a multidimensional random variable with probability density function
a constant unknown or difficult to compute.
, a parameter that can be adjusted as we choose to improve the properties of the method.
be a random variable uniformly distributed on the set
Coming back to the first statement, a similar argument shows that
The above statement does not specify how one should perform the uniform sampling in
However, the interest of this method is that under mild conditions on
One can define the rectangular bounding box
and maximize the acceptance ratio of this sampling.
is already convenient for the rejection sampling step.
For illustration purposes, it can be interesting to draw the set, in which case it can be useful to know the parametric description of its boundary:
is a strictly increasing and differentiable function such that
is a random variable uniformly distributed in
Assume that we want to sample the exponential distribution,
, which allows us to plot the shape of the set (see graph).
This inequality also allows us to determine the rectangular bounding box
From here, we can draw pairs of uniform random variables
To apply the method of the ratio of uniforms, with a given
, one should first determine the boundaries of the rectangular bounding box
This can be done numerically, by computing the minimum and maximum of
It is possible to optimize the acceptance ratio by adjusting the value of