SeaWiFS
Active from September 1997 to December 2010, its primary mission was to quantify chlorophyll produced by marine phytoplankton (microscopic plants).
SeaWiFS was the only scientific instrument on GeoEye's OrbView-2 (AKA SeaStar) satellite, and was a follow-on experiment to the Coastal Zone Color Scanner on Nimbus 7.
The sensor recorded information in the following optical bands: The instrument was specifically designed to monitor ocean characteristics such as chlorophyll-a concentration and water clarity.
The reflectance (R) returned by this formula is then plugged into a cubic polynomial that relates the band ratio to chlorophyll.
These data can also be used to assess atmospheric correction (discussed below) that also can greatly influence chlorophyll concentration calculations.
[5] Many satellite estimates range from one-third to three times of those directly recorded at sea, though the overall relationship is still quite good.
The benefits of chlorophyll data from satellites far outweigh any flaws in their accuracy simply by the spatial and temporal coverage possible.
[8] A description of the light, or radiance, observed by the satellite's sensor can be more formally expressed by the following radiative transfer equation:
Though SeaWiFS was designed primarily to monitor ocean chlorophyll a concentrations from space, it also collected many other parameters that are freely available to the public for research and educational purposes.
These parameters aside from chlorophyll a include reflectance, the diffuse attenuation coefficient, particulate organic carbon (POC) concentration, particulate inorganic carbon (PIC) concentration, colored dissolved organic matter (CDOM) index, photosynthetically active radiation (PAR), and normalized fluorescence line height (NFLH).
The website allows users to browse individual SeaWiFS images based on time and area selections.
Data are provided at numerous temporal scales including daily, multiple days (e.g., 3, 8), monthly, and seasonal images, all the way up to composites of the entire mission.
Scientists who aim to create calculations of chlorophyll or other parameters that differ from those provided on the OceanColor website would likely use Level 1 or 2 data.
NASA offers free software designed specifically to work with SeaWiFS data through the ocean color website.
Other software or programming languages can also be used to read in and work with SeaWiFS data, such as Matlab, IDL, or Python.
Estimating the amount of global or regional chlorophyll, and therefore phytoplankton, has large implications for climate change and fisheries production.
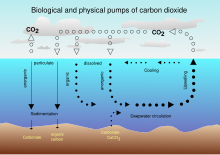
Phytoplankton play a huge role in the uptake of the world's carbon dioxide, a primary contributor to climate change.
Therefore, the degree of primary production from the ocean could play a large role in slowing climate change.
Some have proposed fertilizing the ocean with iron in order to promote phytoplankton blooms and remove carbon dioxide from the atmosphere.
[11] More recent research suggests that positive relationships between chlorophyll a and fisheries production can be modeled[12] and can be very highly correlated when examined on the proper scale.
For example, Ware and Thomson (2005) found an r2 of 0.87 between resident fish yield (metric tons km-2) and mean annual chlorophyll a concentrations (mg m-3).