Sectoral balances
The approach is used by scholars at the Levy Economics Institute to support macroeconomic modelling and by Modern Monetary Theorists to illustrate the relationship between government budget deficits and private saving.
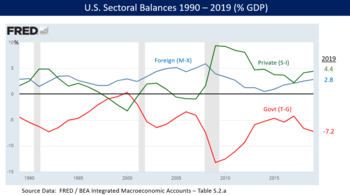
There was also a current account deficit of 2.8% GDP, meaning the foreign sector was in surplus.
[7] Godley wrote in 2005 that: "[T]he deficit of the general government (federal, state, and local) is everywhere and always equal (by definition) to the current account deficit plus the private sector balance (the excess of private saving over investment).
"[8] Expressed as a formula, the sectoral balance identity is: (Savings - Investment) + (Imports - Exports) + (Tax Revenues - Outlays) = 0; or (S-I) + (M-X) + (T-G) =0, as described below.
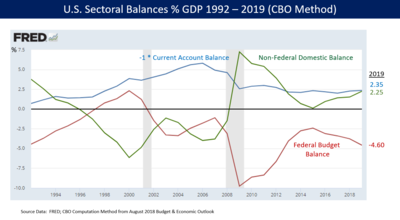
The U.S. Congressional Budget Office discussed sectoral balances in its August 2018 economic outlook: "For example, the unique pattern of the balances in the early years of this century reflected increased borrowing by households and businesses that later proved to be unsustainable.
Starting with the recession of 2001 and continuing through the expansion of the early- to mid-2000s, both the federal government and the U.S. domestic private sector were net borrowers.
That borrowing was funded by foreign investors, and current-account deficits climbed throughout the period, reaching an all-time high of 6.0% of gross domestic product (GDP) in fiscal year 2006.
[6] Economist Wynne Godley explained in 2004-2005 how U.S. sector imbalances posed a significant risk to the U.S. and global economy.
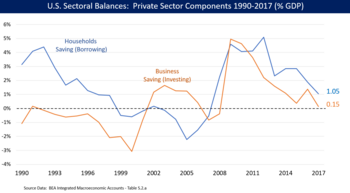
[7] "The financial balance of the private sector shifted towards surplus by the almost unbelievable cumulative total of 11.2 per cent of gross domestic product between the third quarter of 2007 and the second quarter of 2009, which was when the financial deficit of US government (federal and state) reached its peak...No fiscal policy changes explain the collapse into massive fiscal deficit between 2007 and 2009, because there was none of any importance.
The collapse is explained by the massive shift of the private sector from financial deficit into surplus or, in other words, from boom to bust.
"[7] Economist Paul Krugman also explained in December 2011 the causes of the sizable shift from private deficit to surplus: "This huge move into surplus reflects the end of the housing bubble, a sharp rise in household saving, and a slump in business investment due to lack of customers.
"[10] Economists at the New Policy Institute explained in 2011 that: "In a healthy economy, businesses invest using money borrowed from households who are saving for future consumption.
"[2] GDP (Gross Domestic Product) is the value of all goods and services sold within a country during one year.
Flows are derived from the National Accounting relationship between aggregate spending and income.
Hence, equation (4) can be rearranged to get the accounting identity for the three sectoral balances – private domestic, government budget and external: or or which implies that deficits at home (private and government) result in current account or trade deficits, and thus borrowing from abroad.
This is because a budget deficit means that a government has deposited more money into private bank accounts than it has removed in taxes.
A budget surplus means the opposite: in total, the government has removed more money from private bank accounts via taxes than it has put back in via spending.
Therefore, budget surpluses are required only when the economy has excessive aggregate demand, and is in danger of inflation.
According to the sectoral balances approach, austerity can be counterproductive in a downturn due to a significant private-sector financial surplus, in which consumer savings is greater than business investment.
In a healthy economy, the amount borrowed or invested by companies is greater than or equal to the private-sector savings placed into the banking system by consumers.
However, if consumers have increased their savings but companies are not investing, a surplus develops in the banking system.
Economist Richard Koo described similar effects for several of the developed world economies in December 2011: "Today private sectors in the U.S., the U.K., Spain, and Ireland (but not Greece) are undergoing massive deleveraging [paying down debt rather than spending] in spite of record low interest rates.
With borrowers disappearing and banks reluctant to lend, it is no wonder that, after nearly three years of record low interest rates and massive liquidity injections, industrial economies are still doing so poorly.
Flow of funds data for the U.S. show a massive shift away from borrowing to savings by the private sector since the housing bubble burst in 2007.
The shift for the private sector as a whole represents over 9 percent of U.S. GDP at a time of zero interest rates.