Serial analysis of gene expression
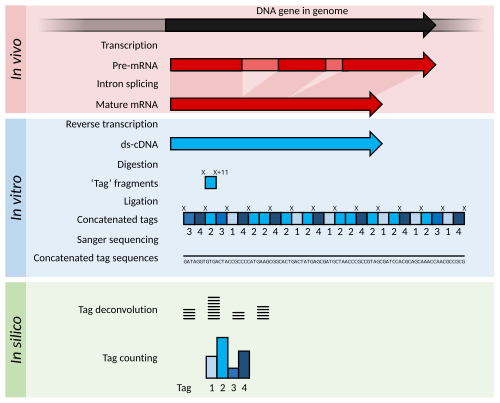
Serial Analysis of Gene Expression (SAGE) is a transcriptomic technique used by molecular biologists to produce a snapshot of the messenger RNA population in a sample of interest in the form of small tags that correspond to fragments of those transcripts.
Statistical methods can be applied to tag and count lists from different samples in order to determine which genes are more highly expressed.
In 1979 teams at Harvard and Caltech extended the basic idea of making DNA copies of mRNAs in vitro to amplifying a library of such in bacterial plasmids.
[9] In this year, the original SAGE protocol was published by Victor Velculescu at the Oncology Center of Johns Hopkins University.
[9] Although SAGE was originally conceived for use in cancer studies, it has been successfully used to describe the transcriptome of other diseases and in a wide variety of organisms.
Quantifying gene expressions is more exact in SAGE because it involves directly counting the number of transcripts whereas spot intensities in microarrays fall in non-discrete gradients and are prone to background noise.
MicroRNAs, or miRNAs for short, are small (~22nt) segments of RNA which have been found to play a crucial role in gene regulation.
One of the most commonly used methods for cloning and identifying miRNAs within a cell or tissue was developed in the Bartel Lab and published in a paper by Lau et al. (2001).
LongSAGE was a more robust version of the original SAGE developed in 2002 which had a higher throughput, using 20 μg of mRNA to generate a cDNA library of thousands of tags.