Seriation (archaeology)
In archaeology, seriation is a relative dating method in which assemblages or artifacts from numerous sites in the same culture are placed in chronological order.
In Europe, it has been used frequently to reconstruct the chronological sequence of graves in a cemetery (e.g. Jørgensen 1992;[1] Müssemeier, Nieveler et al.
Contextual seriation is often used for reconstructing the chronological sequence of graves as only the presence or absence of a design style or type is important.
He found that the graves he was uncovering contained no evidence of their dates and their discrete nature meant that a sequence could not be constructed through their stratigraphy.
Shennan (1997, p. 343)[4] presents a seriation result of Danish hoards based on artefact types like daggers, axes, and swords.
The sequence of the first axis of a correspondence analysis is considered the best seriation order (Shennan 1997,[4] p. 342; Lock 2003, p. 127; Jensen & Høilund Nielsen 1997).
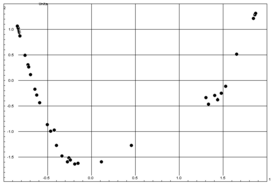
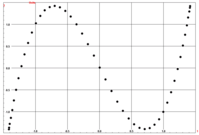
Similarly, a mapping of the component scores for the first two axes of the correspondence analysis result will display a parabola if the design styles considered are controlled by one factor only (like chronology).
[8] Both Kendall and Jensen & Høilund Nielsen (1997) created artificial data sets to show that the parabola results in ideal circumstances.
In 2003, Groenen and Poblome adapted the correspondence analysis algorithm to combine seriation with absolute dates and stratigraphic relationships.
[9][10] The small example below was inspired by Flinders Petrie's serial ordering of Egyptian pottery as published by Renfrew and Bahn (1996, p. 117).
The raw data are stored in an unsorted binary contingency table indicating which design style can be found in which context by a star symbol.
Contextual seriation sorts the design styles and the contexts in such a way that the star symbols are found as close as possible to the diagonal of the table.
Of course, for a small examples like this, no computer programs are needed to find the best ordering, but for larger data sets like the 900 graves studied by Petrie they are extremely helpful.
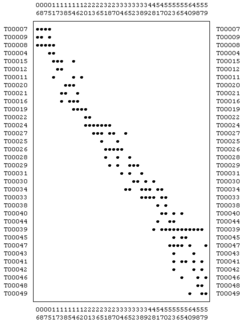
The image above shows the scatterplot with the typical parabola shape of the first two axes of a correspondence analysis for the contexts of the simulated data set.
The contingency table shows 29 contexts with ideal seriation data as created by Kendall and Jensen & Høilund Nielsen (see above).
This ideal example shows that a linear transformation might not be appropriate in all cases, though a simulation study by van de Velden, Groenen and Poblome comes to the conclusion that the predictions of the approach are quite good.


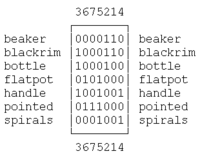
1=context contains the type
0=context does not contain the type