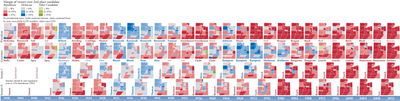
Small multiple
Small multiple designs, multivariate and data bountiful, answer directly by visually enforcing comparisons of changes, of the differences among objects, of the scope of alternatives.
[2][3] Some of the earliest known examples of this type of visualization include the photographic series Horse In Motion by Eadweard Muybridge, around 1886, and Francis Amasa Walker's chart of citizen's occupations in census year 1870 appearing in the Statistical Atlas of the United States.
Muybridge went on to produce many more examples of small multiples showing animal locomotion through the medium of stop-motion photography, including boys playing leapfrog and a bison cantering.
Sketched graphic examples can be found in Francis Amasa Walker's charts appearing in the 1870 Statistical Atlas of the United States.
[6] Several tests of the effectiveness of each method have generally concluded that they have distinct advantages, with animation being better for seeing trends, especially movement, and small multiples being better for making comparisons between times.