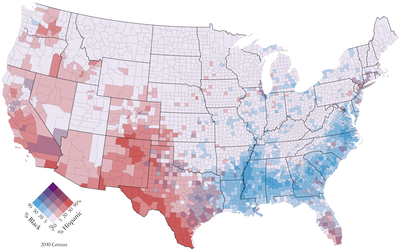
Multivariate map
It has potential to reveal relationships between variables more effectively than a side-by-side comparison of the corresponding univariate maps, but also has the danger of Cognitive overload when the symbols and patterns are too complex to easily understand.
[5] Multivariate thematic maps found a resurgence starting in the middle of the 20th Century, coinciding with the scientific turn in geography.
[7] Their often complex patterns of multiple colors has drawn acclaim and criticism ever since,[8] but has also led to research to discover effective design techniques.
[9][10] Starting in the 1980s, computer software, including the Geographic information system (GIS) facilitated the design and production of multivariate maps.
It has also been suggested that in some cases, a map might not be the best tool for studying a particular multivariate dataset, and other analytical methods may be more enlightening, such as cluster analysis.