Spatial analysis
Spatial analysis is any of the formal techniques which studies entities using their topological, geometric, or geographic properties, primarily used in Urban Design.
It may be applied in fields as diverse as astronomy, with its studies of the placement of galaxies in the cosmos, or to chip fabrication engineering, with its use of "place and route" algorithms to build complex wiring structures.
Mathematics continues to provide the fundamental tools for analysis and to reveal the complexity of the spatial realm, for example, with recent work on fractals and scale invariance.
[3][4] The resulting summary values (e.g., totals, rates, proportions, densities) are influenced by both the shape and scale of the aggregation unit.
Spatial dependence is of importance in applications where it is reasonable to postulate the existence of corresponding set of random variables at locations that have not been included in a sample.
[citation needed] Spatial dependency is the co-variation of properties within geographic space: characteristics at proximal locations appear to be correlated, either positively or negatively.
For example, regression analyses that do not compensate for spatial dependency can have unstable parameter estimates and yield unreliable significance tests.
For example, a set of observations (as points or extracted from raster cells) at matching locations can be intersected and examined by regression analysis.
[citation needed] Spatial sampling involves determining a limited number of locations in geographic space for faithfully measuring phenomena that are subject to dependency and heterogeneity.
It is also possible to exploit ancillary data, for example, using property values as a guide in a spatial sampling scheme to measure educational attainment and income.
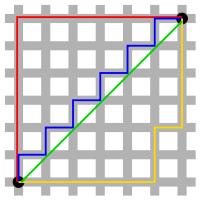
[38] In discussing the coastline of Britain, Benoit Mandelbrot showed that certain spatial concepts are inherently nonsensical despite presumption of their validity.
[40] The ecological fallacy describes errors due to performing analyses on aggregate data when trying to reach conclusions on the individual units.
In geographic space, the observations correspond to locations in a spatial measurement framework that capture their proximity in the real world.
The fundamental tenet is Tobler's First Law of Geography: if the interrelation between entities increases with proximity in the real world, then representation in geographic space and assessment using spatial analysis techniques are appropriate.
Spatial data comes in many varieties and it is not easy to arrive at a system of classification that is simultaneously exclusive, exhaustive, imaginative, and satisfying.
-- G. Upton & B. Fingelton[42] Urban and Regional Studies deal with large tables of spatial data obtained from censuses and surveys.
This change of variables has two main advantages: Factor analysis depends on measuring distances between observations : the choice of a significant metric is crucial.
[44] Using multivariate methods in spatial analysis began really in the 1950s (although some examples go back to the beginning of the century) and culminated in the 1970s, with the increasing power and accessibility of computers.
[46] Brian J Berry, at the University of Chicago, and his students made a wide use of the method,[47] applying it to most important cities in the world and exhibiting common social structures.
A better solution, proposed by psychometricians,[50] groups the data in a « cubic matrix », with three entries (for instance, locations, variables, time periods).
These statistics require measuring a spatial weights matrix that reflects the intensity of the geographic relationship between observations in a neighborhood, e.g., the distances between neighbors, the lengths of shared border, or whether they fall into a specified directional class such as "west".
Spatial interaction or "gravity models" estimate the flow of people, material or information between locations in geographic space.
Agent-based modeling uses software entities (agents) that have purposeful behavior (goals) and can react, interact and modify their environment while seeking their objectives.
For example, one could model traffic flow and dynamics using agents representing individual vehicles that try to minimize travel time between specified origins and destinations.
[62][63] ABM approaches rely on agents' decision rules (in many cases extracted from qualitative research base methods such as questionnaires).
[64] Recent Machine Learning Algorithms calibrate using training sets, for instance in order to understand the qualities of the built environment.
Geospatial and Hydrospatial analysis, using GIS, was developed for problems in the environmental and life sciences, in particular ecology, geology and epidemiology.
Hydrospatial is particularly used for the aquatic side and the members related to the water surface, column, bottom, sub-bottom and the coastal zones.
Descriptive statistics, such as cell counts, means, variances, maxima, minima, cumulative values, frequencies and a number of other measures and distance computations are also often included in this generic term spatial analysis.
Some more advanced statistical techniques include Getis-ord Gi* or Anselin Local Moran's I which are used to determine clustering patterns of spatially referenced data.