Tauc plot
In his original work Jan Tauc (/taʊts/) showed that the optical absorption spectrum of amorphous germanium resembles the spectrum of the indirect transitions in crystalline germanium (plus a tail due to localized states at lower energies), and proposed an extrapolation to find the optical bandgap of these crystalline-like states.
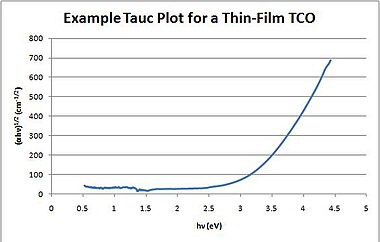
[4] Typically, a Tauc plot shows the quantity hν (the photon energy) on the abscissa (x-coordinate) and the quantity (αhν)1/2 on the ordinate (y-coordinate), where α is the absorption coefficient of the material.
Thus, extrapolating this linear region to the abscissa yields the energy of the optical bandgap of the amorphous material.
A similar procedure is adopted to determine the optical bandgap of crystalline semiconductors.
[5] In this case, however, the ordinate is given by (α)1/r, in which the exponent 1/r denotes the nature of the transition:[6],[7],[8] Again, the resulting plot (quite often, incorrectly identified as a Tauc plot) has a distinct linear region that, extrapolated to the abscissa, yields the energy of the optical bandgap of the material.