Timeline of the 2020 Atlantic hurricane season

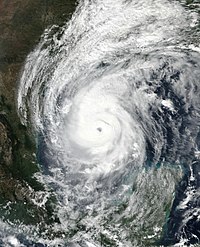
[5] Hurricane Laura produced catastrophic storm surge levels, heavy rainfall, and spawned over a dozen tornadoes after striking Louisiana on August 27 with winds of 150 mph (240 km/h).

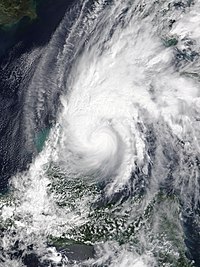
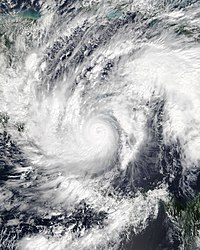
[6] Causing significant late-season loss of life and widespread destruction were November hurricanes Eta and Iota, which made landfall in Central America as Category 4 storms just two weeks apart.

[7] In March 2021, the names Laura, Eta and Iota were retired from reuse in the North Atlantic by the World Meteorological Organization due to the extraordinary amount of damage and number of fatalities they caused.

[8] This timeline documents tropical cyclone formations, strengthening, weakening, landfalls, extratropical transitions, and dissipations during the season.

Additionally, figures for maximum sustained winds and position estimates are rounded to the nearest 5 units (knots, miles, or kilometers), following National Hurricane Center practice.

A satellite image of Tropical Storm Arthur near the Atlantic Coast of North Carolina on May 18, 2020.
Tropical Storm Arthur off the North Carolina coast near peak intensity on May 18
A satellite image of Tropical Storm Cristobal after landfall in Campeche on June 3, 2020.
Tropical Storm Cristobal shortly after landfall in Campeche on June 3
A satellite image of Tropical Storm Fay near the Atlantic Coast of New Jersey on July 10, 2020.
Tropical Storm Fay at peak intensity shortly before landfall in New Jersey on July 10
A satellite image of Hurricane Hanna near the Gulf of Mexico Coast of Texas on July 25, 2020.
Hurricane Hanna at peak intensity making landfall in Texas on July 25
A satellite image of Hurricane Isaias near the Atlantic Coast of the Carolinas on August 3, 2020.
Hurricane Isaias intensifying near the Carolinas on August 3
A satellite image of Hurricane Marco and Tropical Storm Laura on August 23, 2020.
Marco over the Gulf of Mexico and Laura over Hispaniola on August 23
An infrared satellite image of Hurricane Nana at peak intensity making landfall in Belize on September 3, 2020.
Infrared imagery of Hurricane Nana at peak intensity while making landfall in Belize on September 3
A map plotting the track and intensity of Hurricane Paulette at 6-hour intervals during its September 7–28, 2020, lifetime.
Map plotting the track and the intensity of Paulette , the season's longest-lived storm
A satellite image of the five tropical cyclones that were active in the Atlantic Ocean on September 14, 2020.
Five simultaneous tropical cyclones active in the Atlantic on September 14: Sally (left), Paulette (center left), Rene (center right), Teddy (bottom right), and Vicky (far right)
A satellite image of Hurricane Gamma at landfall on the Yucatán Peninsula on October 3, 2020.
Hurricane Gamma making landfall on the Yucatán Peninsula at peak intensity on October 3
A satellite image of Hurricane Delta over the Gulf of Mexico on October 8, 2020.
Hurricane Delta nearing its secondary peak intensity on October 8
A satellite image of Hurricane Eta shortly before landfall in Nicaragua on November 3, 2020.
Hurricane Eta shortly before landfall in Nicaragua on November 3
A satellite loop image showing Hurricane Iota continuing to rapidly intensify while approaching the Caribbean Coast of Nicaragua on November 16, 2020.
Satellite loop of Hurricane Iota rapidly strengthening to near peak intensity while approaching Nicaragua on November 16