Trophic level
The path along the chain can form either a one-way flow or a part of a wider food "web".
The word trophic derives from the Greek τροφή (trophē) referring to food or nourishment.
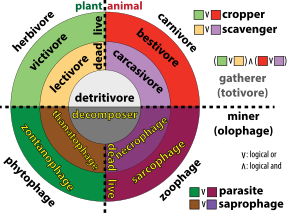
[6] Thus food chains start with primary producers and end with decay and decomposers.
Since decomposers recycle nutrients, leaving them so they can be reused by primary producers, they are sometimes regarded as occupying their own trophic level.
[9] A 2013 study estimates the average trophic level of human beings at 2.21, similar to pigs or anchovies.
[10] This is only an average, and plainly both modern and ancient human eating habits are complex and vary greatly.
For example, a traditional Inuit living on a diet consisting primarily of seals would have a trophic level of nearly 5.
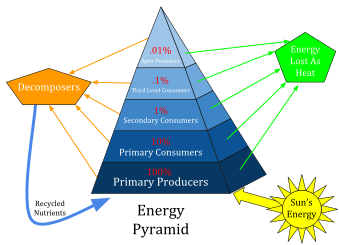
Consumers at each level convert on average only about 10% of the chemical energy in their food to their own organic tissue (the ten-per cent law).
At the lowest trophic level (the bottom of the food chain), plants convert about 1% of the sunlight they receive into chemical energy.
It follows from this that the total energy originally present in the incident sunlight that is finally embodied in a tertiary consumer is about 0.001%[7] Both the number of trophic levels and the complexity of relationships between them evolve as life diversifies through time, the exception being intermittent mass extinction events.
The feeding habits of a juvenile animal, and, as a consequence, its trophic level, can change as it grows up.
The upper value, 5.0, is unusual, even for large fish,[16] though it occurs in apex predators of marine mammals, such as polar bears and orcas.
Earlier reports found precipitous declines in mean trophic level of fisheries catch, in a process known as fishing down the food web.
[20] However, more recent work finds no relation between economic value and trophic level;[21] and that mean trophic levels in catches, surveys and stock assessments have not in fact declined, suggesting that fishing down the food web is not a global phenomenon.
[22] However Pauly et al. note that trophic levels peaked at 3.4 in 1970 in the northwest and west-central Atlantic, followed by a subsequent decline to 2.9 in 1994.
They consider that this is part of the global fishery collapse,[17][23] which finds an echo in the overfished Mediterranean Sea.
Fisheries catch, at least, to begin with, will tend to increase as the trophic level declines.
[8] Such decreases explain the "backward-bending" plots of trophic level versus catch originally observed by Pauly and others in 1998.