Tropical cyclone forecast model
Statistical models forecast the evolution of a tropical cyclone in a simpler manner, by extrapolating from historical datasets, and thus can be run quickly on platforms such as personal computers.
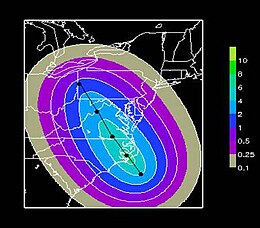
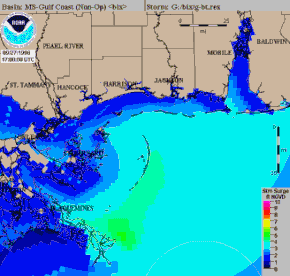
Four primary types of forecasts exist for tropical cyclones: track, intensity, storm surge, and rainfall.
Both consensus and superensemble forecasts can use the guidance of global and regional models runs to improve the performance more than any of their respective components.
It used the newly developed North Atlantic tropical cyclone database to find storms with similar tracks.
It then shifted their tracks through the storm's current path, and used location, direction and speed of motion, and the date to find suitable analogs.
[2] Since 1972, the Climatology and Persistence (CLIPER) statistical model has been used to help generate tropical cyclone track forecasts.
[2] A series of statistical-dynamical models, which used regression equations based upon CLIPER output and the latest output from primitive equation models run at the National Meteorological Center, then National Centers for Environmental Prediction, were developed between the 1970s and 1990s and were named NHC73, NHC83, NHC90, NHC91, and NHC98.
[1][4] Within the field of tropical cyclone track forecasting, despite the ever-improving dynamical model guidance which occurred with increased computational power, it was not until the decade of the 1980s when numerical weather prediction showed skill, and until the 1990s when it consistently outperformed statistical or simple dynamical models.
[1] A similar model was developed for the northwest Pacific Ocean and Southern Hemisphere known as the Statistical Intensity Prediction System (STIPS), which accounts for land interactions through the input environmental conditions from the Navy Operational Global Prediction System (NOGAPS) model.
The Logistic Growth Equation Model (LGEM) uses the same input as SHIPS but within a simplified dynamical prediction system.
It was based on a simplified set of atmospheric dynamical equations (the equivalent barotropic formulation) using a deep layer-mean wind.
[2] In the early 1980s, the assimilation of satellite-derived winds from water vapor, infrared, and visible satellite imagery was found to improve tropical cyclones track forecasting.
[1] Tested in 1989 and 1990, The Vic Ooyama Barotropic (VICBAR) model used a cubic-B spline representation of variables for the objective analysis of observations and solutions to the shallow-water prediction equations on nested domains, with the boundary conditions defined as the global forecast model.
[18] It was implemented operationally as the Limited Area Sine Transform Barotropic (LBAR) model in 1992, using the GFS for boundary conditions.
[1] Across the northwest Pacific and Southern Hemisphere, a ten-member STIPS consensus is formed from the output of the NOGAPS, GFS, the Japanese GSM, the Coupled Ocean/Atmosphere Mesoscale Prediction System (COAMPS), the UKMET, the Japanese TYM, the GFDL with NOGAPS boundary conditions, the Air Force Weather Agency (AFWA) Model, the Australian Tropical Cyclone Local Area Prediction System, and the Weber Barotropic Model.
The system reduces errors by an average of 40 kilometres (25 mi) five days into the future when compared to its higher resolution GSM.
All the models improved during SAFA's five-year history and removing erroneous forecasts proved difficult to do in operations.
For some storms the factors affecting the hurricane track are relatively straightforward, and the models are not only accurate but they produce similar forecasts, while for other storms the factors affecting the hurricane track are more complex and different models produce very different forecasts.