Ensemble forecasting
The multiple simulations are conducted to account for the two usual sources of uncertainty in forecast models: (1) the errors introduced by the use of imperfect initial conditions, amplified by the chaotic nature of the equations of the atmosphere, which is often referred to as sensitive dependence on initial conditions; and (2) errors introduced because of imperfections in the model formulation, such as the approximate mathematical methods to solve the equations.
In general, this approach can be used to make probabilistic forecasts of any dynamical system, and not just for weather prediction.
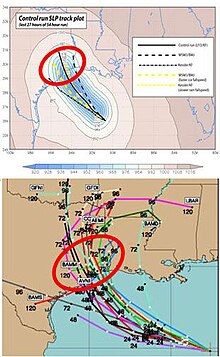
There are various ways of viewing the data such as spaghetti plots, ensemble means or Postage Stamps where a number of different results from the models run can be compared.
As proposed by Edward Lorenz in 1963, it is impossible for long-range forecasts—those made more than two weeks in advance—to predict the state of the atmosphere with any degree of skill owing to the chaotic nature of the fluid dynamics equations involved.
[1] Furthermore, existing observation networks have limited spatial and temporal resolution (for example, over large bodies of water such as the Pacific Ocean), which introduces uncertainty into the true initial state of the atmosphere.
[7] Initial condition uncertainty arises due to errors in the estimate of the starting conditions for the forecast, both due to limited observations of the atmosphere, and uncertainties involved in using indirect measurements, such as satellite data, to measure the state of atmospheric variables.
This explores the range of starting conditions consistent with our knowledge of the current state of the atmosphere, together with its past evolution.
The process of representing the atmosphere in a computer model involves many simplifications such as the development of parametrisation schemes, which introduce errors into the forecast.
When developing a parametrisation scheme, many new parameters are introduced to represent simplified physical processes.
[16] Stochastic parametrisations were first developed at the European Centre for Medium Range Weather Forecasts.
This is combined with consideration of the degree of agreement between various forecasts within the ensemble system, as represented by their overall standard deviation or "spread".
Ensemble spread can be visualised through tools such as spaghetti diagrams, which show the dispersion of one quantity on prognostic charts for specific time steps in the future.
Another tool where ensemble spread is used is a meteogram, which shows the dispersion in the forecast of one quantity for one specific location.
In practice, the probabilities generated from operational weather ensemble forecasts are not highly reliable, though with a set of past forecasts (reforecasts or hindcasts) and observations, the probability estimates from the ensemble can be adjusted to ensure greater reliability.
For forecasts of temperature one simple and effective method of calibration is linear regression, often known in this context as model output statistics.
This has applications in the trading industries, for whom understanding the likely sizes of future forecast changes can be important.
The Observing System Research and Predictability Experiment (THORPEX) is a 10-year international research and development programme to accelerate improvements in the accuracy of one-day to two-week high impact weather forecasts for the benefit of society, the economy and the environment.