Tropical cyclones in 2015
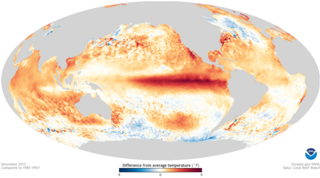
[8] During their March 2015 diagnostic discussion, NOAA's CPC and the IRI reported that El Niño conditions had been observed during February 2015, after the above average sea surface temperatures had become weakly coupled with the tropical atmosphere.
[25][26] Tropical Depression Nine-C subsequently formed in the Central Pacific on 31 December, whose remnants in turn contributed to the development of Hurricane Pali on 7 January.
The lack of activity was primarily attributed to an atmospheric circulation that favored dry, sinking air over low latitudes to the west of 40°W and westerly wind shear enhanced by El Niño.
Tropical cyclogenesis began early, with Ana developing on May 8, over three weeks prior to the official beginning of the season and far ahead of the long-term climatological average of July 9.
The well-above-average activity levels were largely attributed to the strong 2014–16 El Niño event, which brought anomalously high sea surface temperatures and low vertical wind shear to western parts of the basin.
[55] Tropical Storm Mekkhala, on January 13, developed and approached the Philippines where it caused minor damages and also notably interrupted Pope Francis's visit to the country.
During the opening days of March 2015, a major westerly wind burst occurred, which subsequently contributed to the development of the 2014–16 El Niño event and Tropical Storm Bavi.
It slowly consolidated, prompting the Joint Typhoon Warning Center (JTWC) to issue a Tropical Cyclone Formation Alert (TCFA) on June 6.
The system produced extremely heavy downpours, breaking the record in the city of Gwalior, Madhya Pradesh for the maximum amount of rainfall in 24 hours.
Chief Minister of Gujarat Anandiben Patel ordered rescue teams to carry out relief activities in Kutch, Patan, Banaskantha, and other districts of the state, as a result.
[113] Later the same day, the JTWC issued its Tropical Cyclone Formation Alert (TCFA) for the system, and the IMD upgraded the storm to deep depression intensity.
The storm caused severe flooding along the coast, including in Mukalla, the nation's fifth largest city, where the seafront was destroyed by waves exceeding 9 m (30 ft).
By November 8, Megh rapidly intensified into a marginal Extremely Severe Cyclonic Storm, peaking with winds exceeding 175 km/h (110 mph) and a minimum central pressure of 964 mbar (28.47 inHg).
It slowly intensified, prompting the JTWC to issue a Tropical Cyclone Formation Alert (TCFA) for the system, but was eventually cancelled despite the improving appearance prior to landfall.
The IMD later upgraded the system to a deep depression before it crossed the coast of Tamil Nadu near Puducherry the following day with peak wind speeds of 55 km/h (35 mph) and a minimum central pressure of 991 hPa (29.26 inHg).
Due to land interaction and high vertical wind shear, the system weakened into a well-marked low-pressure area over north Tamil Nadu on November 10.
[161] On November 20, the system's organization continued to improve with tight convective banding and it was upgraded to moderate tropical storm status about 270 km (170 mi) south of Diego Garcia.
[161] By November 24, Annabelle's convection became disorganized as a result of increased wind shear induced by an upper level trough and cooler ocean temperatures and it was declared post-tropical.
[162] The tropical depression gradually turned to the south-southwest and exhibited weak convection, leaving the system exposed as it struggled to intensify within a dry air mass.
[162] Bohale maintained its peak intensity of 65 km/h (40 mph) as a moderate tropical storm for 18 hours, before transitioning into a post-tropical depression at 18 UTC while retaining its gale-force winds.
[162] On 2 January, TCWC Perth and Darwin started to monitor Tropical Low 05U, that had developed within the monsoon trough near Wyndham in the Kimberley region of Western Australia.
[194] On 20 December, TCWC Jakarta issued an advisory as the low was inside their area of responsibility, as it was located about 567 km (352 mi) south-southwest of Tanjung Karang.
[citation needed] Late on January 27, RSMC Nadi reported that Tropical Disturbance 08F had developed about 275 km (170 mi) to the southeast of Apia, Samoa.
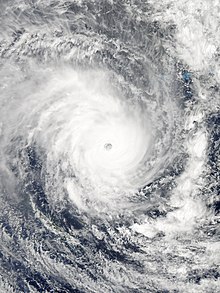
[225] Several hours later, the cyclone began to curve towards the south-southeast, allowing Pam to pass just east of Efate,[226] becoming the single worst natural disaster in the history of Vanuatu.
[227] The cyclone crippled Vanuatu's infrastructure: an estimated 90 percent of the nation's buildings were impacted by the storm's effects, telecommunications were paralyzed, and water shortages took place.
[citation needed] On March 19, RSMC Nadi had reported that Tropical Disturbance 12F had developed about 375 km (235 mi) to the southwest of Apia on the Samoan island of Upolu.
Early on March 22, RSMC Nadi reported that the system had developed into a category 1 tropical cyclone and named it Reuben, while it was located about 220 km (135 mi) to the south of Nukuʻalofa, Tonga.
[234][235] The system was located under an upper-level ridge of high pressure and in a region favouring further development, including low vertical wind shear and sea surface temperatures of above 30 °C (86 °F).
[237][238] The system continued to intensify during that day, before both the JTWC and the FMS reported that Solo had peaked with winds of 100 km/h (60 mph) during April 11, which made it a category 2 tropical cyclone on the Australian scale.
[235] As an indirect effect of Solo significant damage was recorded in New Caledonia, with road impassable in places and the drinking water deteriorated in the municipality of Pouébo.