Visual variable
The concept was first systematized by Jacques Bertin, a French cartographer and graphic designer, and published in his 1967 book, Sémiologie Graphique.
However, the direct study of this abstract use of graphical appearance began with the emergence of cartography as an academic research discipline in the mid-20th Century.
[4] At the same time in France, Jacques Bertin published an early version of his list of visual variables: shape, value, and "sparkling" (grain).
[5] Robinson, in his 1960 Elements of Cartography, which quickly became the dominant textbook on the subject, discussed size, shape, color, and pattern as the qualities of map symbols that establish contrast and represent geographic information.
[6] Bertin was a cartographer at the École pratique des hautes études (EPHE) in Paris, where he created maps and graphics for faculty from various disciplines using a wide variety of data.
Seeing recurring patterns, he created a system for symbolizing qualitative and quantitative information, apparently inspired by the sciences of semiotics, Human vision, and Gestalt psychology (it is sometimes hard to tell because his early works rarely cite any sources), culminating in Sémiologie Graphique.
[5] Despite having a background in cartography, and deriving many of his ideas by evaluating maps, he intended for Sémiologie Graphique to be applied to all forms of graphic design and information visualization.
Soon the idea was gaining international acceptance; in 1974 Joel Morrison presented a very similar system in the context of cartographic generalization, citing neither Bertin nor Robinson but saying that it was a "traditional categorization," suggesting its widespread nature by that point.
Bertin has largely been given credit for the system of visual variables; even though he was not the first to mention the idea, Sémiologie Graphique was the first systematic and theoretical treatment, and his overall approach to graphical symbolization is still in use today with only minor modifications.
[9] The earliest lists commonly suggested six variables: location size, shape, value, hue, orientation, and grain (pattern spacing).
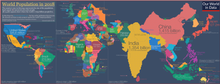
Because geographical features have an actual size on the Earth, this cannot always be controlled, and sometimes works against the wishes of a cartographer; for example, it can be difficult to make a world map in which Russia does not stand out.
Maps often use hue to differentiate categories of nominal variables, such as land cover types or geologic layers.
Although terminology for this aspect still varies somewhat today, texture or pattern in this context generally refers to an aggregate symbol composed of recurring sub-symbols.
Briefly mentioned in the Elements textbook in 1978,[15] the concept was more fully developed by Alan MacEachren in 1992 as a tool for representing locational uncertainty;[16] he first called it focus, then chose crispness, which has been the most common term in subsequent lists.
Specifically, Bertin introduces four properties of these variables, which tie them directly to their role in the visual hierarchy and to their ability to represent data in each of Steven's levels of measurement.
Bertin's classification is rarely mentioned as such, but the resultant applicability preferences form a core part of symbolization, including the power of Size, Value, Saturation, and Resolution for establishing a visual hierarchy, and the following ties to Steven's levels of measurement[2] Each of these variables may be employed to convey information, to provide contrast between different features and layers, to establish figure-ground contrast and a clear visual hierarchy, or add to the aesthetic appeal of the map.