Sensitivity analysis
A mathematical model (for example in biology, climate change, economics, renewable energy, agronomy...) can be highly complex, and as a result, its relationships between inputs and outputs may be faultily understood.
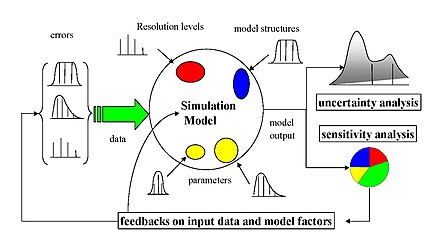
Quite often, some or all of the model inputs are subject to sources of uncertainty, including errors of measurement, errors in input data, parameter estimation and approximation procedure, absence of information and poor or partial understanding of the driving forces and mechanisms, choice of underlying hypothesis of model, and so on.
[3] In models involving many input variables, sensitivity analysis is an essential ingredient of model building and quality assurance and can be useful to determine the impact of a uncertain variable for a range of purposes,[4] including: The object of study for sensitivity analysis is a function
(providing its statistics, moments, pdf, cdf,...), sensitivity analysis aims to measure and quantify the impact of each input
Therefore, the choice of method of sensitivity analysis is typically dictated by a number of problem constraints, settings or challenges.
Some of the most common are: To address the various constraints and challenges, a number of methods for sensitivity analysis have been proposed in the literature, which we will examine in the next section.
They are also distinguished by the type of sensitivity measure, be it based on (for example) variance decompositions, partial derivatives or elementary effects.
In addition, an engineering view of the methods that takes into account the four important sensitivity analysis parameters has also been proposed.
[17][18][19] OAT customarily involves Sensitivity may then be measured by monitoring changes in the output, e.g. by partial derivatives or linear regression.
This means that the OAT approach cannot detect the presence of interactions between input variables and is unsuitable for nonlinear models.
For example, a 3-variable parameter space which is explored one-at-a-time is equivalent to taking points along the x, y, and z axes of a cube centered at the origin.
Compare this to random sampling of the space, where the convex hull approaches the entire volume as more points are added.
Adjoint modelling[23][24] and Automated Differentiation[25] are methods which allow to compute all partial derivatives at a cost at most 4-6 times of that for evaluating the original function.
Similar to OAT, local methods do not attempt to fully explore the input space, since they examine small perturbations, typically one variable at a time.
The regression is required to be linear with respect to the data (i.e. a hyperplane, hence with no quadratic terms, etc., as regressors) because otherwise it is difficult to interpret the standardised coefficients.
Moment-independent methods extend variance-based techniques by considering the probability density or cumulative distribution function of the model output
This is a relevant statistical property also known as Renyi's postulate D.[29] The class of moment-independent sensitivity measures includes indicators such as the
[citation needed] One of the major shortcomings of the previous sensitivity analysis methods is that none of them considers the spatially ordered structure of the response surface/output of the model
[37] More importantly, VARS is able to provide relatively stable and statistically robust estimates of parameter sensitivity with much lower computational cost than other strategies (about two orders of magnitude more efficient).
[40] A number of methods have been developed to overcome some of the constraints discussed above, which would otherwise make the estimation of sensitivity measures infeasible (most often due to computational expense).
Generally, these methods focus on efficiently (by creating a metamodel of the costly function to be evaluated and/or by “ wisely ” sampling the factor space) calculating variance-based measures of sensitivity.
The idea is that, although computer models may be a very complex series of equations that can take a long time to solve, they can always be regarded as a function of their inputs
[42] Then, sensitivity measures can be calculated from the metamodel (either with Monte Carlo or analytically), which will have a negligible additional computational cost.
Some types of metamodels that have been used successfully for sensitivity analysis include: The use of an emulator introduces a machine learning problem, which can be difficult if the response of the model is highly nonlinear.
Sensitivity analysis via Monte Carlo filtering[52] is also a sampling-based approach, whose objective is to identify regions in the space of the input factors corresponding to particular values (e.g., high or low) of the output.
Most often the framing includes more or less implicit assumptions, which could be political (e.g. which group needs to be protected) all the way to technical (e.g. which variable can be treated as a constant).
In order to take these concerns into due consideration the instruments of SA have been extended to provide an assessment of the entire knowledge and model generating process.
It takes inspiration from NUSAP,[54] a method used to qualify the worth of quantitative information with the generation of `Pedigrees' of numbers.
"The importance of understanding and managing uncertainty in model results has inspired many scientists from different research centers all over the world to take a close interest in this subject.
National and international agencies involved in impact assessment studies have included sections devoted to sensitivity analysis in their guidelines.