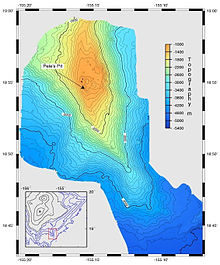
Bathymetry
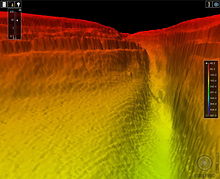
[4] Bathymetric charts (not to be confused with hydrographic charts), are typically produced to support safety of surface or sub-surface navigation, and usually show seafloor relief or terrain as contour lines (called depth contours or isobaths) and selected depths (soundings), and typically also provide surface navigational information.
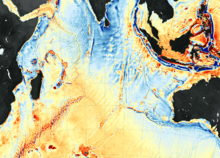
Bathymetric maps (a more general term where navigational safety is not a concern) may also use a digital terrain model and artificial illumination techniques to illustrate the depths being portrayed.
Tidal networks depend on the balance between sedimentary processes and hydrodynamics however, anthropogenic influences can impact the natural system more than any physical driver.
The data used to make bathymetric maps today typically comes from an echosounder (sonar) mounted beneath or over the side of a boat, "pinging" a beam of sound downward at the seafloor or from remote sensing LIDAR or LADAR systems.
In general, a wide swath, which is depth dependent, allows a boat to map more seafloor in less time than a single-beam echosounder by making fewer passes.
The beams update many times per second (typically 0.1–50 Hz depending on water depth), allowing faster boat speed while maintaining 100% coverage of the seafloor.
As of 2010[update] a number of different outputs are generated, including a sub-set of the original measurements that satisfy some conditions (e.g., most representative likely soundings, shallowest in a region, etc.)
Historically, selection of measurements was more common in hydrographic applications while DTM construction was used for engineering surveys, geology, flow modeling, etc.
Satellite radar maps deep-sea topography by detecting the subtle variations in sea level caused by the gravitational pull of undersea mountains, ridges, and other masses.
The taking and analysis of bathymetric measurements is one of the core areas of modern hydrography, and a fundamental component in ensuring the safe transport of goods worldwide.
The application of HS sensors in regards to the imaging of the seafloor is the detection and monitoring of chlorophyll, phytoplankton, salinity, water quality, dissolved organic materials, and suspended sediments.
[14][clarification needed] High-density airborne laser bathymetry (ALB) is a modern, highly technical, approach to the mapping the seafloor.
[15] ALB generally operates in the form of a pulse of non-visible light being emitted from a low-flying aircraft and a receiver recording two reflections from the water.
SHOALS was first developed to help the United States Army Corps of Engineers (USACE) in bathymetric surveying by a company called Optech in the 1990s.
The result of this process is an orthoimage, a scale image which includes corrections made for feature displacement such as building tilt.
[22] Single-beam echo sounders were used from the 1920s-1930s to measure the distance of the seafloor directly below a vessel at relatively close intervals along the line of travel.
[22] The mapping of the sea floor started by using sound waves, contoured into isobaths and early bathymetric charts of shelf topography.
These provided the first insight into seafloor morphology, though mistakes were made due to horizontal positional accuracy and imprecise depths.
Sidescan sonar was developed in the 1950s to 1970s and could be used to create an image of the bottom, but the technology lacked the capacity for direct depth measurement across the width of the scan.
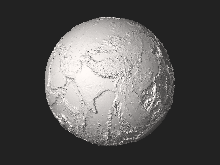
In 1957, Marie Tharp, working with Bruce Charles Heezen, created the first three-dimensional physiographic map of the world's ocean basins.
Early methods included hachure maps, and were generally based on the cartographer's personal interpretation of limited available data.
Further development of sonar based technology have allowed more detail and greater resolution, and ground penetrating techniques provide information on what lies below the bottom surface.
Airborne and satellite data acquisition have made further advances possible in visualisation of underwater surfaces: high-resolution aerial photography and orthoimagery is a powerful tool for mapping shallow clear waters on continental shelves, and airborne laser bathymetry, using reflected light pulses, is also very effective in those conditions, and hyperspectral and multispectral satellite sensors can provide a nearly constant stream of benthic environmental information.
Remote sensing techniques have been used to develop new ways of visualizing dynamic benthic environments from general geomorphological features to biological coverage.
[25] A bathymetric chart is a type of isarithmic map that depicts the submerged bathymetry and physiographic features of ocean and sea bottoms.