Bjerrum plot
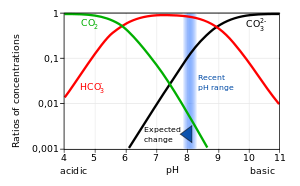
A Bjerrum plot (named after Niels Bjerrum), sometimes also known as a Sillén diagram (after Lars Gunnar Sillén), or a Hägg diagram (after Gunnar Hägg)[1] is a graph of the concentrations of the different species of a polyprotic acid in a solution, as a function of pH,[2] when the solution is at equilibrium.
Due to the many orders of magnitude spanned by the concentrations, they are commonly plotted on a logarithmic scale.
In the example given here, it illustrates the response of seawater pH and carbonate speciation due to the input of man-made CO2 emission by the fossil fuel combustion.
The values of K1 and K2, and therefore the curves in the Bjerrum plot, vary substantially with temperature and salinity.
At any equilibrium, the concentrations are unchanging, hence the left hand sides of these equations are zero.