Cash-flow diagram
A cash-flow diagram is a financial tool used to represent the cashflows associated with a security, "project", or business.
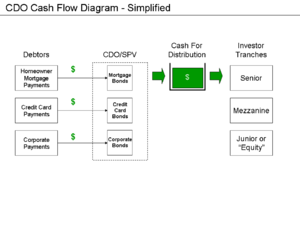
As per the graphics, cash flow diagrams are widely used in structuring and analyzing securities, particularly swaps.
They may also be used to represent payment schedules for bonds, mortgages and other types of loans.
These diagrams - and the associated modelling - are then used to determine a break-even point ("cash flow neutrality"), or to further, and more generally, analyze operations and profitability.
You can help Wikipedia by expanding it.This finance-related article is a stub.