Cladogram
A cladogram (from Greek clados "branch" and gramma "character") is a diagram used in cladistics to show relations among organisms.
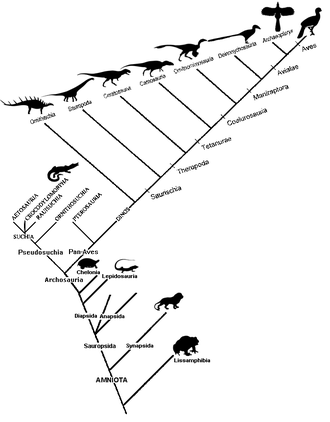
[1][2][3][4][5] A cladogram uses lines that branch off in different directions ending at a clade, a group of organisms with a last common ancestor.
These branching off points represent a hypothetical ancestor (not an actual entity) which can be inferred to exhibit the traits shared among the terminal taxa above it.
The characteristics used to create a cladogram can be roughly categorized as either morphological (synapsid skull, warm blooded, notochord, unicellular, etc.)
[7] Prior to the advent of DNA sequencing, cladistic analysis primarily used morphological data.
[8] As DNA sequencing has become cheaper and easier, molecular systematics has become a more and more popular way to infer phylogenetic hypotheses.
Another powerful method of reconstructing phylogenies is the use of genomic retrotransposon markers, which are thought to be less prone to the problem of reversion that plagues sequence data.
They are also generally assumed to have a low incidence of homoplasies because it was once thought that their integration into the genome was entirely random; this seems at least sometimes not to be the case, however.
Note that character states unique to a single terminal (autapomorphies) do not provide evidence of grouping.
A homoplasy is a character state that is shared by two or more taxa due to some cause other than common ancestry.
However, homoplasy is often not evident from inspection of the character itself (as in DNA sequence, for example), and is then detected by its incongruence (unparsimonious distribution) on a most-parsimonious cladogram.
[12] A well-known example of homoplasy due to convergent evolution would be the character, "presence of wings".
Although the wings of birds, bats, and insects serve the same function, each evolved independently, as can be seen by their anatomy.
Of course, the only reason a homoplasy is recognizable in the first place is because there are other characters that imply a pattern of relationships that reveal its homoplastic distribution.
For example, phenetic algorithms, such as UPGMA and Neighbor-Joining, group by overall similarity, and treat both synapomorphies and symplesiomorphies as evidence of grouping, The resulting diagrams are phenograms, not cladograms, Similarly, the results of model-based methods (Maximum Likelihood or Bayesian approaches) that take into account both branching order and "branch length," count both synapomorphies and autapomorphies as evidence for or against grouping, The diagrams resulting from those sorts of analysis are not cladograms, either.
Algorithms for cladograms or other types of phylogenetic trees include least squares, neighbor-joining, parsimony, maximum likelihood, and Bayesian inference.
[15] Algorithms that perform optimization tasks (such as building cladograms) can be sensitive to the order in which the input data (the list of species and their characteristics) is presented.