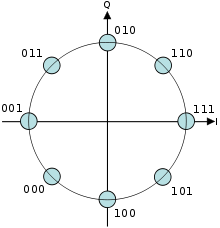
Constellation diagram
[1] It displays the signal as a two-dimensional xy-plane scatter diagram in the complex plane at symbol sampling instants.
In a digital modulation system, information is transmitted as a series of samples, each occupying a uniform time slot.
So each sample encodes one of a finite number of "symbols", which in turn represent one or more binary digits (bits) of information.
After passing through a communication channel, due to electronic noise or distortion added to the signal, the amplitude and phase received by the demodulator may differ from the correct value for the symbol.
The set of sample values which the demodulator classifies as a given symbol can be represented by a region in the plane drawn around each constellation point.
Most demodulators choose, as its estimate of what was actually transmitted, the constellation point which is closest (in a Euclidean distance sense) to that of the received sample; this is called maximum likelihood detection.
On the constellation diagram these detection regions can be easily represented by dividing the plane by lines equidistant from each adjacent pair of points.
Practical modulation systems are designed to maximize the minimum noise needed to cause a symbol error; on the constellation diagram this means that the distance between each pair of adjacent points is equal.