Ellingham diagram
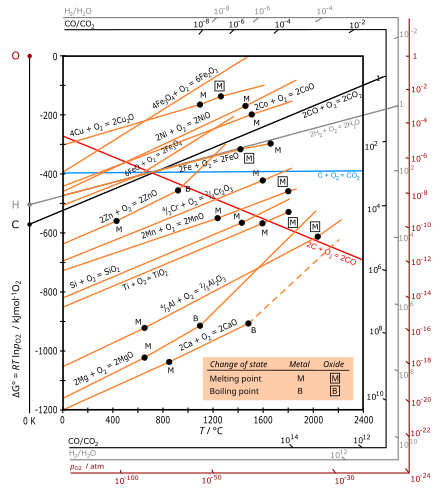
The Ellingham diagram plots the Gibbs free energy change (ΔG) for each oxidation reaction as a function of temperature.
[3] The diagram shown refers to 1 mole O2, so that e.g. the line for the oxidation of chromium shows ΔG for the reaction 4⁄3 Cr(s) + O2(g) → 2⁄3 Cr2O3(s), which is 2⁄3 of the molar Gibbs energy of formation ΔGf°(Cr2O3, s).
In the temperature ranges commonly used, the metal and the oxide are in a condensed state (solid or liquid), and oxygen is a gas with a much larger molar entropy.
At a sufficiently high temperature, the sign of ΔG may invert (becoming positive) and the oxide can spontaneously reduce to the metal, as shown[where?]
For oxidation of carbon, the red line is for the formation of CO: C(s) + 1⁄2 O2(g) → CO(g) with an increase in the number of moles of gas, leading to a positive ΔS and a negative slope.
The blue line for the formation of CO2 is approximately horizontal, since the reaction C(s) + O2(g) → CO2(g) leaves the number of moles of gas unchanged so that ΔS is small.
In industrial processes, the reduction of metal oxides is often effected by a carbothermic reaction, using carbon as a reducing agent.
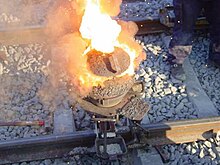
In pyrometallurgy, aluminium is used as a reducing agent in the aluminothermic process, also known as the thermite reaction, to extract chromium and manganese by reduction of their oxides.
The original paper by Ellingham explicitly to the reduction of both oxygen and sulfur by metallurgical processes,[1] and anticipated the use of such diagrams for other compounds, including chlorides, carbides, and sulfates.
Ellingham diagrams are now available for bromides, chlorides, fluorides, hydrides, iodides, nitrides, oxides, sulfides, selenides, and tellurides.