Gaussian network model
The model has a wide range of applications from small proteins such as enzymes composed of a single domain, to large macromolecular assemblies such as a ribosome or a viral capsid.
Protein domain dynamics plays key roles in a multitude of molecular recognition and cell signalling processes.
The resultant dynamic modes cannot be generally predicted from static structures of either the entire protein or individual domains.
At the molecular level, many biological phenomena, such as catalytic activity of an enzyme, occur within the range of nano- to millisecond timescales.
Normal mode analysis in the context of GNM, or elastic network (EN) models in general, provides insights on the longer-scale functional dynamic behaviors of macromolecules.
Here, the model captures native state functional motions of a biomolecule at the cost of atomic detail.
[1][2] The GNM is often analyzed using normal mode analysis, which offers an analytical formulation and unique solution for each structure.
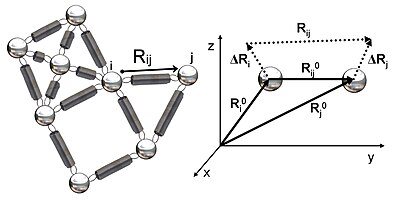
The potential energy of the network in terms of ΔRi is where γ is a force constant uniform for all springs and Γij is the ijth element of the Kirchhoff (or connectivity) matrix of inter-residue contacts, Γ, defined by rc is a cutoff distance for spatial interactions and taken to be 7 Å for amino acid pairs (represented by their α-carbons).
Expressing the X, Y and Z components of the fluctuation vectors ΔRi as ΔXT = [ΔX1 ΔX2 ..... ΔXN], ΔYT = [ΔY1 ΔY2 ..... ΔYN], and ΔZT = [ΔZ1 ΔZ2 ..... ΔZN], above equation simplifies to In the GNM, the probability distribution of all fluctuations, P(ΔR) is isotropic and Gaussian where kB is the Boltzmann constant and T is the absolute temperature.
Since, <ΔRi2> and <ΔRi · ΔRj> follows The GNM normal modes are found by diagonalization of the Kirchhoff matrix, Γ = UΛUT.
By definition, a diagonal element of the Kirchhoff matrix, Γii, is equal to the degree of a node in GNM that represents the corresponding residue's coordination number.
This expression shows that local packing density makes a significant contribution to expected fluctuations of residues.
In X-ray crystallography the B-factor (also called Debye-Waller or temperature factor) of each atom is a measure of its mean-square fluctuation near its equilibrium position in the native structure.
Fast (high frequency) modes, on the other hand, describe uncorrelated motions not inducing notable changes in the structure.
GNM-based methods do not provide real dynamics but only an approximation based on the combination and interpolation of normal modes.