X-ray crystallography
In its first decades of use, this method determined the size of atoms, the lengths and types of chemical bonds, and the atomic-scale differences between various materials, especially minerals and alloys.
X-ray crystal structures can also help explain unusual electronic or elastic properties of a material, shed light on chemical interactions and processes, or serve as the basis for designing pharmaceuticals against diseases.
The preliminary steps include preparing good quality samples, careful recording of the diffracted intensities, and processing of the data to remove artifacts.
Haüy's study led to the idea that crystals are a regular three-dimensional array (a Bravais lattice) of atoms and molecules; a single unit cell is repeated indefinitely along three principal directions.
In the 19th century, a complete catalog of the possible symmetries of a crystal was worked out by Johan Hessel,[3] Auguste Bravais,[4] Evgraf Fedorov,[5] Arthur Schönflies[6] and (belatedly) William Barlow (1894).
[11] X-rays are not only waves but also have particle properties causing Sommerfeld to coin the name Bremsstrahlung for the continuous spectra when they were formed when electrons bombarded a material.
The idea that crystals could be used as a diffraction grating for X-rays arose in 1912 in a conversation between Paul Peter Ewald and Max von Laue in the English Garden in Munich.
Von Laue worked with two technicians, Walter Friedrich and his assistant Paul Knipping, to shine a beam of X-rays through a copper sulfate crystal and record its diffraction on a photographic plate.
[20][21] Von Laue developed a law that connects the scattering angles and the size and orientation of the unit-cell spacings in the crystal, for which he was awarded the Nobel Prize in Physics in 1914.
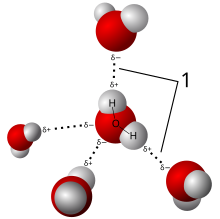
[26][27][28] The distribution of electrons in the table-salt structure showed that crystals are not necessarily composed of covalently bonded molecules, and proved the existence of ionic compounds.
Other early structures included copper,[32] calcium fluoride (CaF2, also known as fluorite), calcite (CaCO3) and pyrite (FeS2)[33] in 1914; spinel (MgAl2O4) in 1915;[34][35] the rutile and anatase forms of titanium dioxide (TiO2) in 1916;[36] pyrochroite (Mn(OH)2) and, by extension, brucite (Mg(OH)2) in 1919.
[39] The structure of graphite was solved in 1916[40] by the related method of powder diffraction,[41] which was developed by Peter Debye and Paul Scherrer and, independently, by Albert Hull in 1917.
[50] Her conclusions were anticipated by William Henry Bragg, who published models of naphthalene and anthracene in 1921 based on other molecules, an early form of molecular replacement.
[70] In the field of organometallic chemistry, the X-ray structure of ferrocene initiated scientific studies of sandwich compounds,[71][72] while that of Zeise's salt stimulated research into "back bonding" and metal-pi complexes.
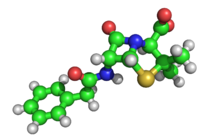
X-ray crystallography of biological molecules took off with Dorothy Crowfoot Hodgkin, who solved the structures of cholesterol (1937), penicillin (1946) and vitamin B12 (1956), for which she was awarded the Nobel Prize in Chemistry in 1964.
In general, small molecules are also easier to crystallize than macromolecules; however, X-ray crystallography has proven possible even for viruses and proteins with hundreds of thousands of atoms, through improved crystallographic imaging and technology.
The crystal should be sufficiently large (typically larger than 0.1 mm in all dimensions), pure in composition and regular in structure, with no significant internal imperfections such as cracks or twinning.
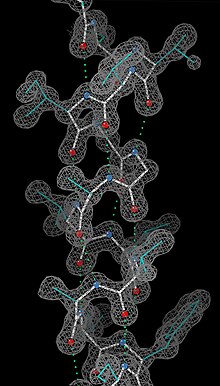
[citation needed] In the third step, these data are combined computationally with complementary chemical information to produce and refine a model of the arrangement of atoms within the crystal.
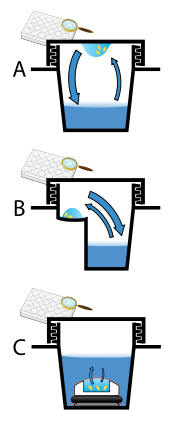
[105] In practice, favorable conditions are identified by screening; a very large batch of the molecules is prepared, and a wide variety of crystallization solutions are tested.
Due to the difficulty in obtaining such large quantities (milligrams) of crystallization-grade protein, robots have been developed that are capable of accurately dispensing crystallization trial drops that are in the order of 100 nanoliters in volume.
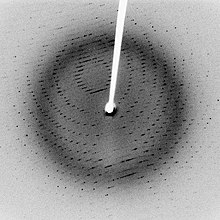
To collect all the necessary information, the crystal must be rotated step-by-step through 180°, with an image recorded at every step; actually, slightly more than 180° is required to cover reciprocal space, due to the curvature of the Ewald sphere.
The repetitive technique of crystallographic data collection and the often high symmetry of crystalline materials cause the diffractometer to record many symmetry-equivalent reflections multiple times.
This allows calculating the symmetry-related R-factor, a reliability index based upon how similar are the measured intensities of symmetry-equivalent reflections,[clarification needed] thus assessing the quality of the data.
Most available tools allowing phase identification and structural refinement are based on the Rietveld method,[120][121] some of them being open and free software such as FullProf Suite,[122][123] Jana2006,[124] MAUD,[125][126][127] Rietan,[128] GSAS,[129] etc.
She confirmed the structure of the benzene ring, carried out studies of diamond, was one of the first two women to be elected to the Royal Society in 1945, and in 1949 was appointed the first female tenured professor of chemistry and head of the Department of crystallography at University College London.
It is utopian, then, to suggest that any country that really wants married women to return to a scientific career, when her children no longer need her physical presence, should make special arrangements to encourage her to do so?".
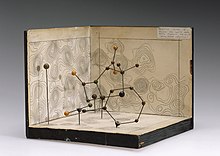
Rosalind Franklin took the X-ray photograph of a DNA fibre that proved key to James Watson and Francis Crick's discovery of the double helix, for which they both won the Nobel Prize for Physiology or Medicine in 1962.
Yet only her husband Jerome shared the 1985 Nobel Prize in Chemistry with Herbert Hauptman, "for outstanding achievements in the development of direct methods for the determination of crystal structures".
For many years Lonsdale edited the International Tables for Crystallography, which provide information on crystal lattices, symmetry, and space groups, as well as mathematical, physical and chemical data on structures.
Eleanor Dodson, an Australian-born biologist, who began as Dorothy Hodgkin's technician, was the main instigator behind CCP4, the collaborative computing project that currently shares more than 250 software tools with protein crystallographers worldwide.