Genetic distance
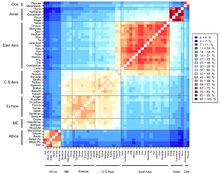
Genetic distance is useful for reconstructing the history of populations, such as the multiple human expansions out of Africa.
[5] Creating a comprehensive tree of life that represents all the organisms that have ever lived on earth is important for understanding the evolution of life in the face of all challenges faced by living organisms to deal with similar challenges in future.
Fossil dating and molecular clock are the two means of generating evolutionary history of living organisms.
[5] Molecular clocks on the other hand are specific sequences of DNA, RNA or proteins (amino acids) that are used to determine at molecular level the similarities and differences among species, to find out the timeline of divergence,[6] and to trace back the common ancestor of species based on the mutation rates and sequence changes being accumulated in those specific sequences.
For example, gene for alpha-globin (constituent of hemoglobin) mutates at a rate of 0.56 per base pair per billion years.
Random fluctuation of allele frequencies also produces genetic differentiation between populations.
[7] Let’s suppose a sequence of DNA or a hypothetical gene that has mutation rate of one base per 10 million years.
For example, in Figure 2 a difference of 4 bases in the hypothetical sequence among those two species would indicate that they diverged 40 million years ago, and their common ancestor would have lived at least 20 million years ago before their divergence.
[8] Number of mutation ÷ Mutation per year (rate of mutation) = time since divergence Recent advancement in sequencing technology and the availability of comprehensive genomic databases and bioinformatics tools that are capable of storing and processing colossal amount of data generated by the advanced sequencing technology has tremendously improved evolutionary studies and the understanding of evolutionary relationships among species.
[9][10] Different biomolecular markers such DNA, RNA and amino acid sequences (protein) can be used for determining the genetic distance.
[11][12] The selection criteria[13] of appropriate biomarker for genetic distance entails the following three steps: The choice of variability depends on the intended outcome.
[19] Different statistical measures exist that aim to quantify genetic deviation between populations or species.
By utilizing assumptions gained from experimental analysis of evolutionary forces, a model that more accurately suits a given experiment can be selected to study a genetic group.
Additionally, comparing how well different metrics model certain population features such as isolation can identify metrics that are more suited for understanding newly studied groups[20] The most commonly used genetic distance metrics are Nei's genetic distance,[7] Cavalli-Sforza and Edwards measure,[21] and Reynolds, Weir and Cockerham's genetic distance.
This measure is constructed based on the assumption that no insertions or deletions occurred, all substitutions are independent, and that each nucleotide change is equally likely.
This distance has the nice property that if the rate of genetic change (amino acid substitution) is constant per year or generation then Nei's standard genetic distance (D) increases in proportion to divergence time.
[24] Nei's standard distance can then be written as[7] In 1967 Luigi Luca Cavalli-Sforza and A. W. F. Edwards published this measure.
One major advantage of this measure is that the populations are represented in a hypersphere, the scale of which is one unit per gene substitution.
to simplify the formula at the cost of losing the property that the scale is one unit per gene substitution.
In 1983, this measure was published by John Reynolds, Bruce Weir and C. Clark Cockerham.
[25] It is worth noting when transition and transversion type substitutions have an equal chance of occurring, and
This method is not ideal in cases where natural selection plays a significant role in a populations genetics.
The foundational principles outlined in these works is used not only in euclidean spaces but expanded upon by Issac Newton and Gottfried Leibniz in isolated pursuits to create calculus.
[32] As seen in figure 6, this method can be visualized in a graphical manner, this is due to the work of René Descartes who created the fundamental principle of analytic geometry, or the cartesian coordinate system.
In an interesting example of historical repetitions, René Descartes was not the only one who discovered the fundamental principle of analytical geometry, this principle was as discovered in an isolated pursuit by Pierre de Fermat who left his work unpublished.
: Allele frequencies at locus u in populations X and Y, respectively It was specifically developed for microsatellite markers and is based on the stepwise-mutation model (SMM).
However, Czekanowski assumes a direct path is not available and sums the sides of the triangle formed by the data points instead of finding the hypotenuse.
This formula is nicknamed the Manhattan distance because its methodology is similar to the nature of the New York City burrow.
Manhattan is mainly built on a grid system requiring resentence to only make 90 degree turns during travel, which parallels the thinking of the formula.
[39] A commonly used measure of genetic distance is the fixation index (FST) which varies between 0 and 1.