Tropical cyclone
A tropical cyclone is a rapidly rotating storm system with a low-pressure area, a closed low-level atmospheric circulation, strong winds, and a spiral arrangement of thunderstorms that produce heavy rain and squalls.
Tropical cyclones are very rare in the South Atlantic (although occasional examples do occur) due to consistently strong wind shear and a weak Intertropical Convergence Zone.
[6] Within this broad area of low-pressure, air is heated over the warm tropical ocean and rises in discrete parcels, which causes thundery showers to form.
[1] These warning centers issue advisories which provide basic information and cover a systems present, forecast position, movement and intensity, in their designated areas of responsibility.
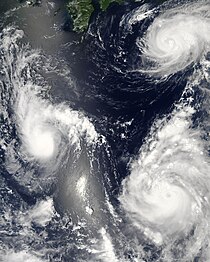
[29] During La Niña years, the formation of tropical cyclones, along with the subtropical ridge position, shifts westward across the western Pacific Ocean, which increases the landfall threat to China and much greater intensity in the Philippines.
[45][46] It is plausible that extreme wind waves see an increase as a consequence of changes in tropical cyclones, further exacerbating storm surge dangers to coastal communities.
[47] A 2021 study review article concluded that the geographic range of tropical cyclones will probably expand poleward in response to climate warming of the Hadley circulation.
[53] According to World Weather Attribution the influence of climate change on the rainfall of some latest hurricanes can be described as follows:[54] Tropical cyclone intensity is based on wind speeds and pressure.
[56][57] The most intense storm on record is Typhoon Tip in the northwestern Pacific Ocean in 1979, which reached a minimum pressure of 870 hPa (26 inHg) and maximum sustained wind speeds of 165 kn (85 m/s; 305 km/h; 190 mph).
[71][72] Dry air entraining into a tropical cyclone's core has a negative effect on its development and intensity by diminishing atmospheric convection and introducing asymmetries in the storm's structure.
[84] The Brown ocean effect can allow a tropical cyclone to maintain or increase its intensity following landfall, in cases where there has been copious rainfall, through the release of latent heat from the saturated soil.
[85] Orographic lift can cause a significant increase in the intensity of the convection of a tropical cyclone when its eye moves over a mountain, breaking the capped boundary layer that had been restraining it.
[1] The SMAP uses an L-band radiometer channel to determine the wind speeds of tropical cyclones at the ocean surface, and has been shown to be reliable at higher intensities and under heavy rainfall conditions, unlike scatterometer-based and other radiometer-based instruments.
The ADT, used by a large number of forecasting centers, uses infrared geostationary satellite imagery and an algorithm based upon the Dvorak technique to assess the intensity of tropical cyclones.
[114][115] Formal naming schemes have subsequently been introduced for the North and South Atlantic, Eastern, Central, Western and Southern Pacific basins as well as the Australian region and Indian Ocean.
[19][20][23] Tropical cyclones that develop around the world are assigned an identification code consisting of a two-digit number and suffix letter by the warning centers that monitor them.
A tropical cyclone can become extratropical as it moves toward higher latitudes if its energy source changes from heat released by condensation to differences in temperature between air masses.
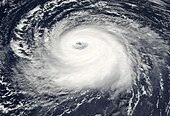
[122] In a weaker storm, the eye may be obscured by the central dense overcast, which is the upper-level cirrus shield that is associated with a concentrated area of strong thunderstorm activity near the center of a tropical cyclone.
[141] When wind shear and latent heat release is present, tropical cyclones tend to move towards regions where potential vorticity is increasing most quickly.
[67] On land, strong winds can damage or destroy vehicles, buildings, bridges, and other outside objects, turning loose debris into deadly flying projectiles.
[187] In October 2019, Typhoon Hagibis struck the Japanese island of Honshu and inflicted US$15 billion in damage, making it the costliest storm on record in Japan.
[195] The Caribbean islands are regularly hit by hurricanes, which have caused multiple humanitarian crises in Haiti since 2004 due in part to the lack of infrastructure and high population density in urban areas.
[214][215] The storm surge and winds of hurricanes may be destructive to human-made structures, but they also stir up the waters of coastal estuaries, which are typically important fish breeding locales.
[244] Major tropical cyclones leave traces in overwash records and shell layers in some coastal areas, which have been used to gain insight into hurricane activity over the past thousands of years.
[244] Proxy records based on paleotempestological research have revealed that major hurricane activity along the Gulf of Mexico coast varies on timescales of centuries to millennia.
[1] It took several years for some of the warning centers to take advantage of this new viewing platform and develop the expertise to associate satellite signatures with storm position and intensity.
[1] Intense tropical cyclones pose a particular observation challenge, as they are a dangerous oceanic phenomenon, and weather stations, being relatively sparse, are rarely available on the site of the storm itself.
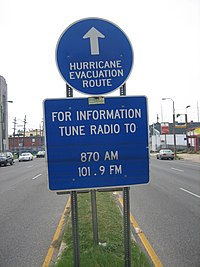
[273][274][275] When a tropical cyclone develops and is forecast to impact land, each member nation of the World Meteorological Organization issues various watches and warnings to cover the expected effects.
[286][288] Common injuries arise from falls from heights, such as from a ladder or from level surfaces; from electrocution in flooded areas, including from backfeed from portable generators; or from motor vehicle accidents.
[285][288][289] Long and irregular shifts may lead to sleep deprivation and fatigue, increasing the risk of injuries, and workers may experience mental stress associated with a traumatic incident.