Energy profile (chemistry)
Chemists use reaction coordinate diagrams as both an analytical and pedagogical aid for rationalizing and illustrating kinetic and thermodynamic events.
[2][3] Molecular mechanics is empirically based and potential energy is described as a function of component terms that correspond to individual potential functions such as torsion, stretches, bends, Van der Waals energies, electrostatics and cross terms.
[3][4][5] Each component potential function is fit to experimental data or properties predicted by ab initio calculations.
[4] Molecular mechanics is useful in predicting equilibrium geometries and transition states as well as relative conformational stability.
As a reaction occurs the atoms of the molecules involved will generally undergo some change in spatial orientation through internal motion as well as its electronic environment.
[1] Distortions in the geometric parameters result in a deviation from the equilibrium geometry (local energy minima).
[2][3] PES is an important concept in computational chemistry and greatly aids in geometry and transition state optimization.
However, overall translational or rotational degrees do not affect the potential energy of the system, which only depends on its internal coordinates.
For a system described by n-internal coordinates a separate potential energy function can be written with respect to each of these coordinates by holding the other n – 1 parameters at a constant value allowing the potential energy contribution from a particular molecular motion (or interaction) to be monitored while the other n – 1 parameters are defined.
Stationary points occur when the 1st partial derivative of the energy with respect to each geometric parameter is equal to zero.
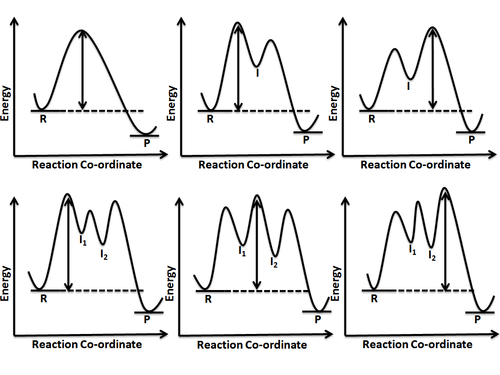
Minima represent stable or quasi-stable species, i.e. reactants and products with finite lifetime.
A reaction coordinate diagram may also have one or more transient intermediates which are shown by high energy wells connected via a transition state peak.
Any chemical structure that lasts longer than the time for typical bond vibrations (10−13 – 10−14s) can be considered as intermediate.
[4] A reaction involving more than one elementary step has one or more intermediates being formed which, in turn, means there is more than one energy barrier to overcome.
However, if the two energy barriers for reactant-to-intermediate and intermediate-to-product transformation are nearly equal, then no complete equilibrium is established and steady state approximation is invoked to derive the kinetic rate expressions for such a reaction.
[7] Although a reaction coordinate diagram is essentially derived from a potential energy surface, it is not always feasible to draw one from a PES.
Hammond postulate is another tool which assists in drawing the energy of a transition state relative to a reactant, an intermediate or a product.
This postulate helps to accurately predict the shape of a reaction coordinate diagram and also gives an insight into the molecular structure at the transition state.
Depending on these parameters, a reaction can be favorable or unfavorable, fast or slow and reversible or irreversible, as shown in figure 8.
Practically, enthalpies, not free energy, are used to determine whether a reaction is favorable or unfavorable, because ∆H° is easier to measure and T∆S° is usually too small to be of any significance (for T < 100 °C).
If the starting material and product(s) are in equilibrium then their relative abundance is decided by the difference in free energy between them.
For instance, the reaction of an carboxylic acid with amines to form a salt takes place with K of 105–6, and at ordinary temperatures, this process is regarded as irreversible.
Yet, with sufficient heating, the reverse reaction takes place to allow formation of the tetrahedral intermediate and, ultimately, amide and water.
A reaction can also be rendered irreversible if a subsequent, faster step takes place to consume the initial product(s), or a gas is evolved in an open system.
If a reaction is carried out at relatively lower temperature, then the product formed is one lying across the smaller energy barrier.
If the transition state structure corresponds to a less charged species then increasing the solvents polarity would decrease the reaction rate since a more polar solvent would be more effective at stabilizing the starting material (ΔGo would decrease which in turn increases ΔG‡).


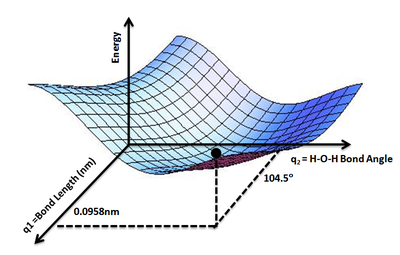
Shows the energy minimum corresponding to optimized molecular structure for water, O−H bond length of 0.0958 nm and H−O−H bond angle of 104.5°
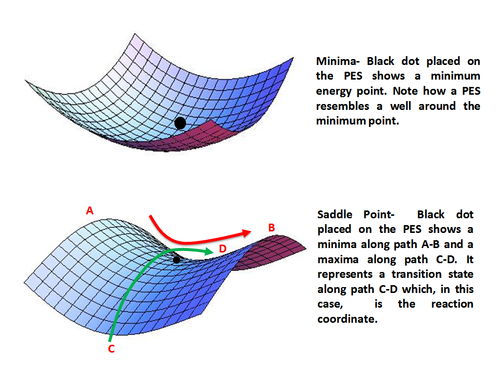
Minima (top) and Saddle Point (bottom) on a Potential Energy Surface