Data transformation (statistics)
However, if the population is substantially skewed and the sample size is at most moderate, the approximation provided by the central limit theorem can be poor, and the resulting confidence interval will likely have the wrong coverage probability.
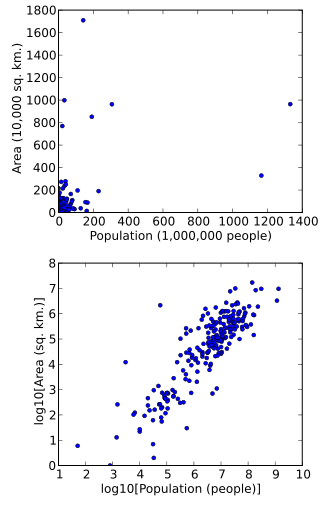
Simply rescaling units (e.g., to thousand square kilometers, or to millions of people) will not change this.
However, following logarithmic transformations of both area and population, the points will be spread more uniformly in the graph.
Another reason for applying data transformation is to improve interpretability, even if no formal statistical analysis or visualization is to be performed.
However, if the goal is to assess how much additional fuel a person would use in one year when driving one car compared to another, it is more natural to work with the data transformed by applying the reciprocal function, yielding liters per kilometer, or gallons per mile.
[5] For example, addition of quadratic functions of the original independent variables may lead to a linear relationship with expected value of Y, resulting in a polynomial regression model, a special case of linear regression.
Another assumption of linear regression is homoscedasticity, that is the variance of errors must be the same regardless of the values of predictors.
Yet another application of data transformation is to address the problem of lack of normality in error terms.
Univariate normality is not needed for least squares estimates of the regression parameters to be meaningful (see Gauss–Markov theorem).
However confidence intervals and hypothesis tests will have better statistical properties if the variables exhibit multivariate normality.
[3] A common situation where a data transformation is applied is when a value of interest ranges over several orders of magnitude.
Many physical and social phenomena exhibit such behavior — incomes, species populations, galaxy sizes, and rainfall volumes, to name a few.
The logarithm is often favored because it is easy to interpret its result in terms of "fold changes".
The distribution is extremely spiky and leptokurtic, this is the reason why researchers had to turn their backs to statistics to solve e.g. authorship attribution problems.
Alternatively, rules of thumb based on the sample skewness and kurtosis have also been proposed.
This is called the rank transform,[14] and creates data with a perfect fit to a uniform distribution.
A variance-stabilizing transformation aims to remove a variance-on-mean relationship, so that the variance becomes constant relative to the mean.
While commonly used for statistical analysis of proportional data, the arcsine square root transformation is not recommended because logistic regression or a logit transformation are more appropriate for binomial or non-binomial proportions, respectively, especially due to decreased type-II error.
[15][3] Univariate functions can be applied point-wise to multivariate data to modify their marginal distributions.