Mode choice
These probabilities are called the modal share, and can be used to produce an estimate of the amount of trips taken using each feasible mode.
This procedure was followed because it was thought that income (resulting in the purchase and use of automobiles) drove mode choice.
At first, the CATS studied the diversion of auto traffic from streets and arterial roads to proposed expressways.
The mode choice version of diversion curve analysis proceeds this way: one forms a ratio, say: where: Given the R that we have calculated, the graph tells us the percent of users in the market that will choose transit.
Transit agencies developed diversion curves for different kinds of situations, so variables like income and population density entered implicitly.
Using data from the CATS, Warner investigated classification techniques using models from biology and psychology.
Analysis is disaggregate in that individuals are the basic units of observation, yet aggregate because models yield a single set of parameters describing the choice behavior of the population.
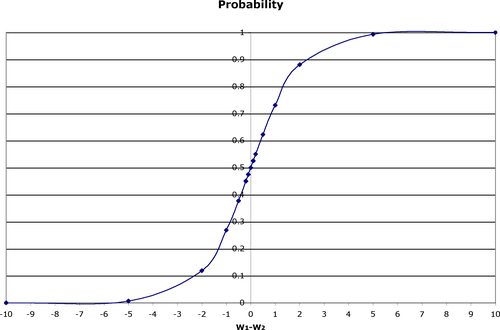
Early psychology work involved the typical experiment: Here are two objects with weights, w1 and w2, which is heavier?
Economists deal with utility rather than physical weights, and say that The characteristics of the object, x, must be considered, so we have If we follow Thurston's assumption, we again have a probit model.
Observe the mathematical similarity between the logit model and the S-curves we estimated earlier, although here share increases with utility rather than time.
The comparison with S-curves is suggestive that modes (or technologies) get adopted as their utility increases, which happens over time for several reasons.
Third technological advances, which occur over time and as the number of users increases, drive down relative cost.
Broadly, utility theory assumes that (1) users and suppliers have perfect information about the market; (2) they have deterministic functions (faced with the same options, they will always make the same choices); and (3) switching between alternatives is costless.
As noted above, we think of observable utility as being a function: where each variable represents a characteristic of the auto trip.
Most modelers say it represents characteristics left out of the equation (e.g., the political correctness of a mode, if I take transit I feel morally righteous, so β0 may be negative for the automobile), but it includes whatever is needed to make error terms NID.
This happens when: The log-likelihood is easier to work with, as the products turn to sums: Consider an example adopted from John Bitzan’s Transportation Economics Notes.
It provides a conceptual framework for travel choices and agendas of activities involving considerations of long and short term memory, effectors, and other aspects of thought and decision processes.
Although there is a lot of attention to behavioral analysis in transportation work, the best of modern psychological ideas are only beginning to enter the field.