History of the United States public debt
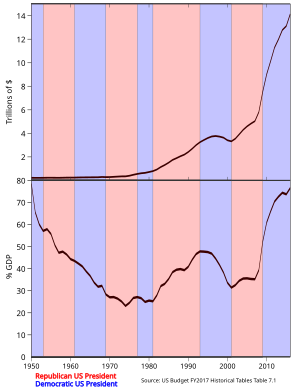
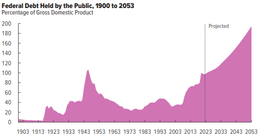
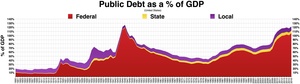
To facilitate comparisons over time, public debt is often expressed as a ratio to gross domestic product (GDP).
Historically, the United States public debt as a share of GDP has increased during wars and recessions, and subsequently declined.
The United States public debt as a percentage of GDP reached its peak during Harry Truman's first presidential term, amidst and after World War II.
It rapidly declined in the post-World War II period, reaching a low in 1973 under President Richard Nixon.
Since then, debt as a share of GDP has consistently risen, with exceptions during the terms of Presidents Jimmy Carter and Bill Clinton.
Public debt sharply rose following the 2007–08 financial crisis, driven by significant tax revenue declines and spending increases.
During the COVID-19 pandemic, US public debt dramatically increased due to emergency measures aimed at sustaining the economy amidst widespread economic retraction across various industries, alongside high unemployment rates.
[2] Except for about a year during 1835–1836, the United States has continuously had a fluctuating public debt since its Constitution went into effect on March 4, 1789.
During the American Revolution, the Continental Congress, under the Articles of Confederation, amassed huge war debts, but lacked the power to repay these obligations through taxation or duties on imports.
[3][4] On the founding of the United States, the financial affairs of the new federation were in disarray, exacerbated by an economic crisis in urban commercial centers.
[5] In 1790, Secretary of the Treasury Alexander Hamilton pushed for Congress to pass a financial plan, called the First Report on the Public Credit,[6] a controversial part of which involved the federal government assuming state debts incurred during the Revolutionary War.
Some states, including Virginia, had already paid off almost half of their debts, and felt that their taxpayers should not be assessed again to bail out the less provident, and further argued that the plan was beyond the constitutional power of the new government.
James Madison, then a representative from Virginia, led a group of legislators from the South in blocking the provision and prevent the plan from gaining approval.
The compromise meant that the state debts were all picked up by the federal Treasury, and the permanent national capital would be located in the South, along the Virginia-Maryland border in what became the District of Columbia.
Jefferson originally approved the scheme, but Madison had turned him around by arguing that federal control of debt would consolidate too much power in the national government.
[citation needed] On January 8, 1835, president Andrew Jackson paid off the entire national debt, the only time in U.S. history that has been accomplished.
Approximately $17 billion in debt was raised through the selling of Liberty Bonds to the general public to finance the U.S.'s military effort.
[18] Warren G. Harding was elected president in 1920 and believed the federal government should be fiscally managed in a way similar to private sector businesses.
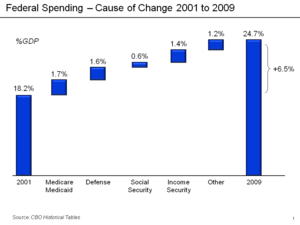
[33] In the early 21st century, debt held by the public relative to GDP rose again due in part to the Bush tax cuts and increased military spending caused by the wars in the Middle East and a new entitlement Medicare D program.
[40][41] David Stockman, former director of the Office of Management and Budget, blamed the "ideological tax-cutters" of the Reagan administration for the increase of national debt during the 1980s.
[42] Former Treasury official Bruce Bartlett attributed the increase in the national debt since the 1980s to the policy of "starve the beast".
Of this total, the CBO attributes 72% to legislated tax rate cuts and spending increases and 27% to economic and technical factors.
[55] The Obama Administration also made four significant accounting changes to more accurately report total federal government spending.
[56] This table lists the U.S. federal debt as a percentage of gross domestic product, or GDP, each year since World War II.

The Federal Government has over 6:1 debt to revenue ratio as of Q3 2022