Nomogram
A nomogram (from Greek νόμος (nomos) 'law' and γράμμα (gramma) 'that which is drawn'), also called a nomograph, alignment chart, or abac, is a graphical calculating device, a two-dimensional diagram designed to allow the approximate graphical computation of a mathematical function.
Nomograms flourished in many different contexts for roughly 75 years because they allowed quick and accurate computations before the age of pocket calculators.
In addition, nomograms naturally incorporate implicit or explicit domain knowledge into their design.
For example, to create larger nomograms for greater accuracy the nomographer usually includes only scale ranges that are reasonable and of interest to the problem.
Also like a slide rule, its accuracy is limited by the precision with which physical markings can be drawn, reproduced, viewed, and aligned.
Other types of graphical calculators—such as intercept charts, trilinear diagrams, and hexagonal charts—are sometimes called nomograms.
These devices do not meet the definition of a nomogram as a graphical calculator whose solution is found by the use of one or more linear isopleths.
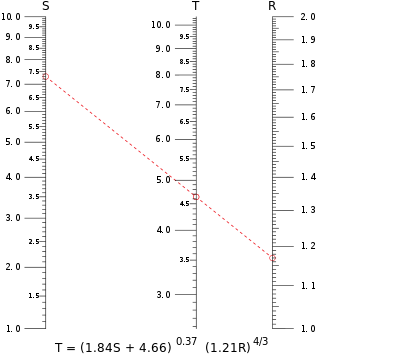
The sample isopleth shown in red on the nomogram at the top of this article calculates the value of T when S = 7.30 and R = 1.17.
The isopleth crosses the scale for T at just under 4.65; a larger figure printed in high resolution on paper would yield T = 4.64 to three-digit precision.
This nomogram is interesting because it performs a useful nonlinear calculation using only straight-line, equally graduated scales.
times larger than the axes scales, the numbers on it exactly match those directly below or to its left, and thus it can be easily created by drawing a straight line diagonally on a sheet of graph paper.
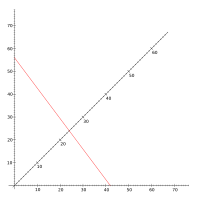
In this manner, the blue line demonstrates the computation of: (9 − 5)2 / 5 = 3.2 and the red line demonstrates the computation of: (81 − 70)2 / 70 = 1.7 In performing the test, Yates's correction for continuity is often applied, and simply involves subtracting 0.5 from the observed values.
A nomogram for performing the test with Yates's correction could be constructed simply by shifting each "observed" scale half a unit to the left, so that the 1.0, 2.0, 3.0, ... graduations are placed where the values 0.5, 1.5, 2.5, ... appear on the present chart.
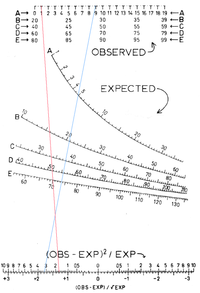
The following one was developed graphically to achieve appropriate end results that could readily be defined by the product of their relationships in subjective units rather than numerically.
The numbers in square boxes denote the axes requiring input after appropriate assessment.
The final pair of parallel logarithmic scales (12) are not nomograms as such, but reading-off scales to translate the risk score (11, remote to extremely high) into a sampling frequency to address safety aspects and other 'consumer protection' aspects respectively.
Using a ruler, one can readily read the missing term of the law of sines or the roots of the quadratic and cubic equation.