Ocean color
[1] This field of study developed alongside water remote sensing, so it is focused mainly on how color is measured by instruments (like the sensors on satellites and airplanes).
The main substances that affect the color of the ocean include dissolved organic matter, living phytoplankton with chlorophyll pigments, and non-living particles like marine snow and mineral sediments.
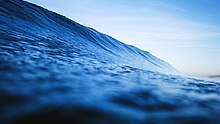
Green waters appear this way because algae and dissolved substances are absorbing light in the blue and red portions of the spectrum.
[12] Microscopic marine algae, called phytoplankton, absorb light in the blue and red wavelengths, due to their specific pigments like chlorophyll-a.
Ocean water appears yellow or brown when large amounts of dissolved substances, sediments, or both types of material are present.
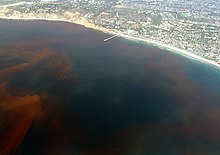
Ocean water can appear red if there is a bloom of a specific kind of phytoplankton causing a discoloration of the sea surface.
Using radiometers, scientists measure the amount of light energy coming from the water at all colors of the electromagnetic spectrum from ultraviolet to near-infrared.
[28] From this reflected spectrum of light energy, or the apparent "color," researchers derive other variables to understand the physics and biology of the oceans.
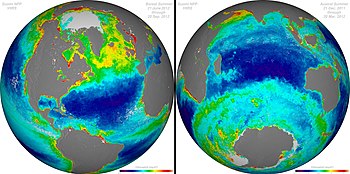
Ocean color measurements can be used to infer important information such as phytoplankton biomass or concentrations of other living and non-living material.
The patterns of algal blooms from satellite over time, over large regions up to the scale of the global ocean, has been instrumental in characterizing variability of marine ecosystems.
Ocean color data is a key tool for research into how marine ecosystems respond to climate change and anthropogenic perturbations.
[31][32] People have written about the color of the ocean over many centuries, including ancient Greek poet Homer’s famous "wine-dark sea."
Scientific measurements of the color of the ocean date back to the invention of the Secchi disk in Italy in the mid-1800s to study the transparency and clarity of the sea.
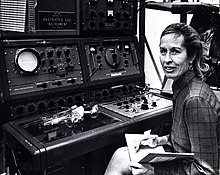
[36] In the 1970s, scientist Howard Gordon and his graduate student George Maul related imagery from the first Landsat mission to ocean color.
Despite the fact that CZCS was an experimental mission intended to last only one year as a proof of concept, the sensor continued to generate a valuable time-series of data over selected test sites until early 1986.
Ocean color data helps researchers map information relevant to society, such as water quality, hazards to human health like harmful algal blooms, bathymetry, and primary production and habitat types affecting commercially-important fisheries.
[46] Phytoplankton are microscopic algae, marine primary producers that turn sunlight into chemical energy that supports the ocean food web.
For example, after hurricanes Katrina and Rita in the Gulf of Mexico, ocean color remote sensing was used to map the effects offshore.
[60][61] There are many kinds of in situ sensors, and the different types are often compared on dedicated field campaigns or lab experiments called "round robins."