Prognostic chart
[clarification needed] The forecast map showing the state of the atmosphere at a future time is called a prognostic chart.
[1] Surface weather prognostic charts for mariners indicate the positions of high and low pressure areas, as well as frontal zones, up to five days into the future.
[5] Manual prognostic charts depict tropical cyclones, turbulence, weather fronts, rain and snow areas, precipitation type and coverage indicators, as well as centers of high and low pressure.
[9] Atmospheric models are computer programs that produce meteorological information, including prognostic charts, for future times at given locations and altitudes.
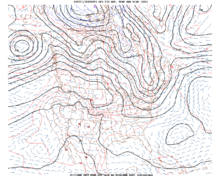
[19] By 1957, it was proposed when isobars or height lines at the 500 hectopascals (15 inHg) pressure level in the atmosphere were being verified, that the degree of persistence should be considered so as to avoid getting bad forecasts for slow moving systems too much credit.