ST elevation
The ST segment is the isoelectric line because there is no voltage difference across cardiac muscle cell membrane during this state.
[1] An ST elevation is considered significant if the vertical distance inside the ECG trace and the baseline at a point 0.04 seconds after the J-point is at least 0.1 mV (usually representing 1 mm or 1 small square) in a limb lead or 0.2 mV (2 mm or 2 small squares) in a precordial lead.
[4] When there is a blockage of the coronary artery, there will be lack of oxygen supply to all three layers of cardiac muscle (transmural ischemia).
[1] Weakening of the electrical activity of the cardiac muscles causes the decrease in height of the R wave in those leads facing it.
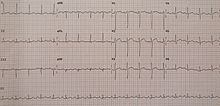
In two weeks after pericarditis, there will be upward concave ST elevation, positive T wave, and PR depression.