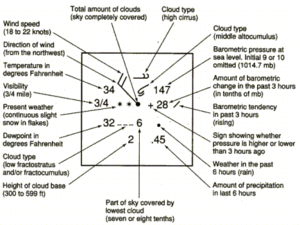
Station model
This allows map users to analyze patterns in atmospheric pressure, temperature, wind speed and direction, cloud cover, precipitation, and other parameters.
Station model plots use an internationally accepted coding convention that has changed little since August 1, 1941.
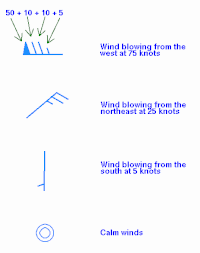
[5] Once plotted on a map, an analysis of isotachs (lines of equal wind speeds) can be accomplished.
[7] In the United States, the change to the modern convention of flags shown on one side of the staff to indicate wind speed took effect on August 1, 1941.
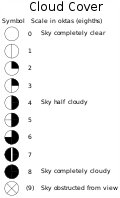
[8][9] Along with wind direction, cloud cover is one of the oldest atmospheric conditions to be coded on a station model.
For pilots, knowledge of the sky cover helps determine if visual flight rules (VFR) are being met.
A nephanalysis, contouring areas that are cloudy with scalloped lines, can be performed to indicate a system's cloud and precipitation pattern.
[5] Since the station model has limited room, it makes no special provision for vertical or multi-level clouds that can occupy more than one étage at a particular time.
[13] Consequently, cloud genera with significant vertical development may be coded and plotted as low or middle depending on the altitude at which they normally form.
[14] Although the SYNOP code has no separate formal group classification for vertical or multi-level clouds, the observer procedure for selecting numerical codes is designed to give high reporting priority to those genera or species that show significant vertical development.
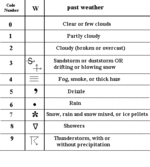
To the left of the cloud shape in the center of the station model is the symbol depicting present weather.
The visibility itself is shown as a number, in statute miles in the United States and meters elsewhere, describing how far the observer can see at that time.
This knowledge is important to meteorologists because when this data is plotted on a map, isotherms and isodrosotherms (lines of equal dew point) are easily analyzed, either by man or machine, which can help determine location of weather fronts.
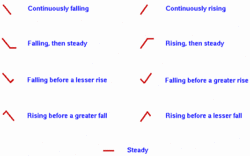
Steady rises can indicate improving conditions and approaching high pressure, and normally occur in the wake of a cold front.